The Slack notification arrived with the heavy, damp enthusiasm of a wet dog jumping into your lap while you are wearing a tuxedo. It was late on a Thursday, the specific hour when ambitious caffeine consumption turns into existential regret, and the message was brief.
“I don’t think I can do this anymore. Not the coding. The infrastructure. I’m out.”
This wasn’t a junior developer overwhelmed by the concept of recursion. This was my lead backend engineer. A human Swiss Army knife who had spent nine years navigating the dark alleys of distributed systems and could stare down a production outage with the heart rate of a sleeping tortoise. He wasn’t leaving because of burnout from long hours, or an equity dispute, or even because someone microwaved fish in the breakroom.
He was leaving because of Kubernetes.
Specifically, he was leaving because the tool we had adopted to “simplify” our lives had slowly morphed into a second, unpaid job that required the patience of a saint and the forensic skills of a crime scene investigator. We had turned his daily routine of shipping features into a high-stakes game of operation where touching the wrong YAML indentation caused the digital equivalent of a sewer backup.
It was a wake-up call that hit me harder than the realization that the Tupperware at the back of my fridge has evolved its own civilization. We treat Kubernetes like a badge of honor, a maturity medal we pin to our chests. But the dirty secret everyone is too polite to whisper at conferences is that we have invited a chaotic, high-maintenance tyrant into our homes and given it the master bedroom.
When the orchestrator becomes a lifestyle disease
We tend to talk about “cognitive load” in engineering with the same sterile detachment we use to discuss disk space or latency. It sounds clean. Manageable. But in practice, the cognitive load imposed by a raw, unabstracted Kubernetes setup is less like a hard drive filling up and more like trying to cook a five-course gourmet meal while a badger is gnawing on your ankle.
The promise was seductive. We were told that Kubernetes would be the universal adapter for the cloud. It would be the operating system of the internet. And in a way, it is. But it is an operating system that requires you to assemble the kernel by hand every morning before you can open your web browser.
My star engineer didn’t want to leave. He just wanted to write code that solved business problems. Instead, he found himself spending 40% of his week debugging ingress controllers that behaved like moody teenagers (silent, sullen, and refusing to do what they were told) and wrestling with pod eviction policies that seemed based on the whim of a vengeful god rather than logic.
We had fallen into the classic trap of Resume Driven Development. We handed application developers the keys to the cluster and told them they were now “DevOps empowered.” In reality, this is like handing a teenager the keys to a nuclear submarine because they once successfully drove a golf cart. It doesn’t empower them. It terrifies them.
(And let’s be honest, most backend developers look at a Kubernetes manifest with the same mix of confusion and horror that I feel when looking at my own tax returns.)
The archaeological dig of institutional knowledge
The problem with complexity is that it rarely announces itself with a marching band. It accumulates silently, like dust bunnies under a bed, or plaque in an artery.
When we audited our setup after the resignation, we found that our cluster had become a museum of good intentions gone wrong. We found Helm charts that were so customized they effectively constituted a new, undocumented programming language. We found sidecar containers attached to pods for reasons nobody could remember, sucking up resources like barnacles on the hull of a ship, serving no purpose other than to make the diagrams look impressive.
This is what I call “Institutional Knowledge Debt.” It represents the sort of fungal growth that occurs when you let complexity run wild. You know it is there, evolving its own ecosystem, but as long as you don’t look at it directly, you don’t have to acknowledge that it might be sentient.
The “Bus Factor” in our team (the number of people who can get hit by a bus before the project collapses) had reached a terrifying number: one. And that one person had just quit. We had built a system where deploying a hotfix required a level of tribal knowledge usually reserved for initiating members into a secret society.
YAML is just a ransom note with better indentation
If you want to understand why developers hate modern infrastructure, look no further than the file format we use to define it. YAML.
We found files in our repository that were less like configuration instructions and more like love letters written by a stalker: intense, repetitive, and terrifyingly vague about their actual intentions.
The fragility of it is almost impressive. A single misplaced space, a tab character where a space should be, or a dash that looked at you the wrong way, and the entire production environment simply decides to take the day off. It is absurd that in an era of AI assistants and quantum computing, our billion-dollar industries hinge on whether a human being pressed the spacebar two times or four times.
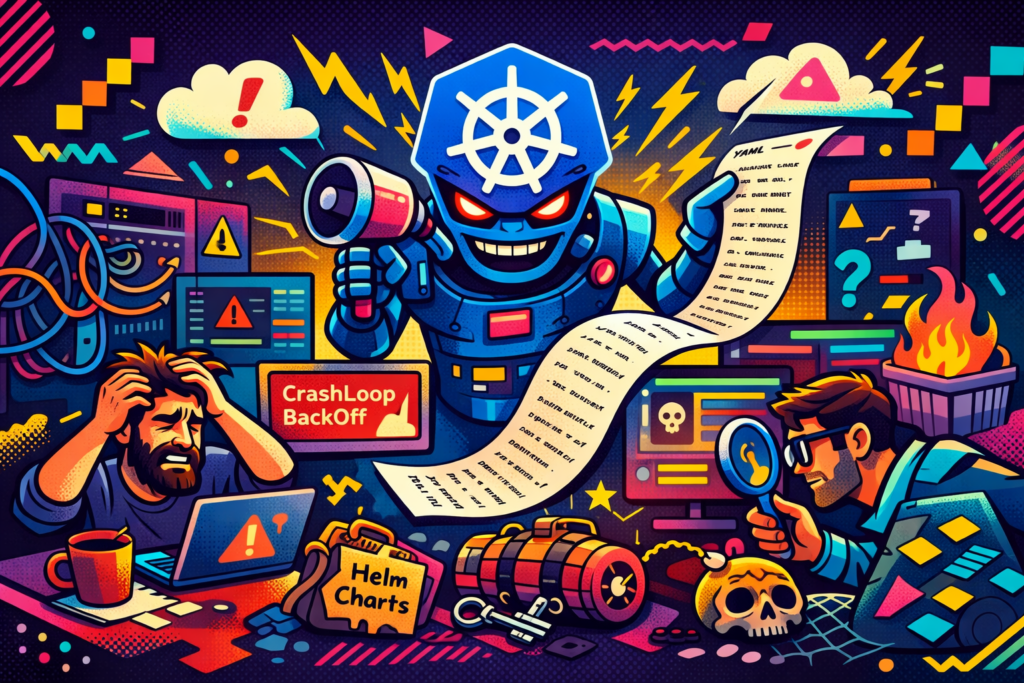
Debugging these files is not engineering. It is hermeneutics. It is reading tea leaves. You stare at the CrashLoopBackOff error message, which is the system’s way of saying “I am unhappy, but I will not tell you why,” and you start making sacrifices to the gods of indentation.
My engineer didn’t hate the logic. He hated the medium. He hated that his intellect was being wasted on the digital equivalent of untangling Christmas lights.
We built a platform to stop the bleeding
The solution to this mess was not to hire “better” engineers who memorized the entire Kubernetes API documentation. That is a strategy akin to buying larger pants instead of going on a diet. It accommodates the problem, but it doesn’t solve it.
We had to perform an exorcism. But not a dramatic one with spinning heads. A boring, bureaucratic one.
We embraced Platform Engineering. Now, that is a buzzword that usually makes my eyes roll back into my head so far I can see my own frontal lobe, but in this case, it was the only way out. We decided to treat the platform as a product and our developers as the customers, customers who are easily confused and frighten easily.
We took the sharp objects away.
We built “Golden Paths.” In plain English, this means we created templates that work. If a developer wants to deploy a microservice, they don’t need to write a 400-line YAML manifesto. They fill out a form that asks five questions: What is it called? How much memory does it need? Who do we call if it breaks?
We hid the Kubernetes API behind a curtain. We stopped asking application developers to care about PodDisruptionBudgets or AffinityRules. Asking a Java developer to configure node affinity is like asking a passenger on an airplane to help calibrate the landing gear. It is not their job, and if they are doing it, something has gone terribly wrong.
Boring is the only metric that matters
After three months of stripping away the complexity, something strange happened. The silence.
The Slack channel dedicated to deployment support, previously a scrolling wall of panic and “why is my pod pending?” screenshots, went quiet. Deployments became boring.
And let me tell you, in the world of infrastructure, boring is the new sexy. Boring means things work. Boring means I can sleep through the night without my phone buzzing across the nightstand like an angry hornet.
Kubernetes is a marvel of engineering. It is powerful, scalable, and robust. But it is also a dense, hostile environment for humans. It is an industrial-grade tool. You don’t put an industrial lathe in your home kitchen to slice carrots, and you shouldn’t force every developer to operate a raw Kubernetes cluster just to serve a web page.
If you are hiring brilliant engineers, you are paying for their ability to solve logic puzzles and build features. If you force them to spend half their week fighting with infrastructure, you are effectively paying a surgeon to mop the hospital floors.
So look at your team. Look at their eyes. If they look tired, not from the joy of creation but from the fatigue of fighting their own tools, you might have a problem. That star engineer isn’t planning their next feature. They are drafting their resignation letter, and it probably won’t be written in YAML.