If your pants feel a little tight after a large Thanksgiving meal, the logical solution is to discreetly unbutton them. You do not typically hire a hitman to assassinate yourself, clone your DNA in a vat, and grow a slightly wider version of yourself just to digest dessert. Yet, for nearly a decade, this is exactly how Kubernetes handled resource management.
When an application slowly consumed all its allocated memory, the standard orchestration response was absolute, violent destruction. We did not give the application more memory. We shot it in the head, deleted its entire existence, and span up a brand new replica with a slightly larger plate. Connections dropped. Warm caches evaporated. State was lost in the digital wind.
Thankfully, the era of the Kubernetes firing squad is drawing to a close. In-place pod resizing has officially graduated to stable General Availability in Kubernetes v1.35, and it changes the fundamental physics of how we manage workloads. We can finally stop burning down the house just to buy a bigger sofa.
Let us explore how this works, why it is practically miraculous, and how to use it without accidentally angering the Linux kernel.
The historical absurdity of pod resource management
Before in-place resizing, if you wanted to change the CPU or memory allocated to a running pod, the workflow was brutally simplistic. You updated your Deployment specification with the new resource requests and limits. The Kubernetes control plane saw the discrepancy between the desired state and the current state. The control plane then instructed the Kubelet to terminate the old pod and create a new one.
Think of taking your car to the mechanic because you need thicker tires. Instead of swapping the tires, the mechanic puts your car into an industrial crusher, hands you an identical car with thicker tires, and tells you to reprogram your radio stations. Sure, the rolling update strategy ensured you had a backup car to drive while the primary one was being crushed, but the specific pod doing the heavy lifting was gone.
For stateless microservices written in Go, this was barely an inconvenience. For a massive Java Virtual Machine holding gigabytes of cached data, or a machine learning inference service handling a traffic spike, a restart was a traumatic event. It meant minutes of downtime, CPU spikes during startup, and a slew of unhappy alerts.
Enter the era of in-place resizing
The magic of Kubernetes v1.35 is that the “resources.requests” and “resources.limits” fields within a pod specification are no longer immutable. You can edit them on the fly.
Under the hood, Kubernetes is finally taking full advantage of Linux control groups (cgroups). A container is basically just a regular Linux process trapped in a highly restrictive administrative box. The kernel has always had the ability to move the walls of this box without killing the process inside. If a container needs more memory, the kernel simply adjusts the cgroup memory limit. It is like a landlord quietly sliding a partition wall outward while you are still sleeping in your bed.
Here is a sanitized example of how you might update a running pod. Notice how we are just applying a patch to an existing, actively running resource.
# We patch the running pod to increase memory limits
# No restarts, no dropped connections, just instant gratification
kubectl patch pod bloated-legacy-api-7b89f5c -p '{"spec":{"containers":[{"name":"main-app","resources":{"limits":{"memory":"4Gi"}}}]}}'
It feels almost illegal the first time you do it. The pod keeps running, the uptime counter keeps ticking, but suddenly the application has breathing room.
The bureaucratic lifecycle of asking for more RAM
Of course, you cannot just demand more resources and expect the universe to instantly comply. The physical node hosting your pod must actually have the spare CPU or memory available. To manage this negotiation, Kubernetes introduces a new field in the pod status called resize.
This field tracks the bureaucratic process of your resource request. It is very much like dealing with the Department of Motor Vehicles, but measured in milliseconds. The statuses are surprisingly descriptive.
First, there is Proposed. This means your request for more resources has been acknowledged. The paperwork is on the desk, but nobody has stamped it yet.
Second, we have “InProgress”. The Kubelet has accepted the request and is currently asking the container runtime (like containerd or CRI-O) to adjust the cgroup limits. The walls are physically moving.
Third, you might see Deferred. This is the orchestrator politely telling you that the node is currently full. Your pod is on a waitlist. As soon as another pod terminates or frees up space, your resize request will be processed. You do not get an error, but you also do not get your RAM. You just wait.
Finally, there is Infeasible. This is Kubernetes looking at you with deep, profound disappointment. You probably asked for 64 Gigabytes of memory on a tiny virtual machine that only has 8 Gigabytes total. The API server essentially stamps your form with a big red “DENIED” and moves on with its life.
Negotiating with stubborn runtimes using resize policies
Not all applications are smart enough to realize they have been gifted more resources. Node.js or Go applications will happily consume newly available CPU cycles without being told. Java applications, on the other hand, are like stubborn mules. If you start a JVM with a maximum heap size of 2 Gigabytes, giving the container 4 Gigabytes of memory will accomplish absolutely nothing. The JVM will stubbornly refuse to look at the new memory until you reboot it.
To handle these varying levels of application intelligence, Kubernetes gives us the resizePolicy array. This allows you to define exactly how the Kubelet should handle changes for each specific resource type.
In this configuration, we are telling Kubernetes a very specific set of rules. If we patch the CPU limits, the Kubelet will adjust the cgroups and leave the container alone (RestartNotRequired). The application will just run faster. However, if we patch the memory limits, the Kubelet knows it must restart the container (RestartContainer) so the application can read the new environment variables and adjust its internal memory management.
The vertical pod autoscaler is your marital therapist
Manually patching pods in the middle of the night is still a terrible way to manage infrastructure. The true power of in-place resizing is unlocked when you pair it with the Vertical Pod Autoscaler.
Historically, the VPA was a bit of a brute. It would watch your pods, realize they needed more memory, and then mercilessly murder them to apply the new sizes. It was effective, but highly destructive.
Now, the VPA features a magical mode called InPlaceOrRecreate. Think of this mode as a highly skilled couples therapist. It sits quietly in the background, observing the relationship between your application and its memory usage. When the application needs more space to grow, the VPA simply slides the walls outward without causing a scene. It only resorts to the nuclear option of recreating the pod if an in-place resize is technically impossible.
apiVersion: autoscaling.k8s.io/v1
kind: VerticalPodAutoscaler
metadata:
  name: smooth-scaling-vpa
spec:
  targetRef:
    apiVersion: apps/v1
    kind: Deployment
    name: frontend-service
  updatePolicy:
    # The magic word that prevents the firing squad
    updateMode: "InPlaceOrRecreate"
With this single setting, your stateful workloads, long-running batch jobs, and memory-hungry APIs can seamlessly adapt to traffic spikes without ever dropping a user request.
The fine print and the rottweiler problem
As with all things in distributed systems, there are rules. You cannot cheat the laws of physics. If a node is completely exhausted of resources, your in-place resize will sit in the Deferred state forever. You still need the Cluster Autoscaler to add fresh physical nodes to your cluster. In-place resizing is a tool for distributing existing wealth, not for printing new money.
Furthermore, we must talk about the danger of scaling down. Increasing memory is a joyous occasion. Reducing memory limits on a running container is like trying to take a juicy steak out of the mouth of a hungry Rottweiler.
The Linux kernel takes memory limits very seriously. If your application is currently using 3 Gigabytes of memory, and you smugly patch the pod to limit it to 2 Gigabytes, the kernel does not politely ask the application to clean up its garbage. The Out Of Memory killer wakes up, grabs an axe, and immediately slaughters your application.
Always scale down memory with extreme caution. It is almost always safer to wait for a natural deployment cycle to reduce memory requests than to try to forcefully shrink a running process.
In the end, in-place pod resizing is not just a neat party trick. It is a fundamental maturation of Kubernetes as an operating system for the cloud. We are no longer treating our workloads like disposable cattle to be slaughtered at the first sign of trouble. We are treating them like slightly demanding house pets. Just give them the bigger bowl of food and let them sleep.
Let us be perfectly honest about multi-cloud environments. They are not a harmonious symphony of computing power. They are a logistical nightmare, roughly equivalent to hosting a dinner party where one guest only eats raw vegan food, another demands a deep-fried turkey, and the third will only consume blue candy. You are running around three different kitchens trying to keep everyone alive and happy while speaking three different languages.
For years, we relied on Terraform or its open-source sibling OpenTofu to manage this chaos. These tools are fantastic, but they come with a terrifying piece of baggage known as the state file. The state file is essentially a fragile, highly sensitive diary holding the deepest, darkest secrets of your infrastructure. If that file gets corrupted or someone forgets to lock it, your cloud provider develops sudden amnesia and forgets where it put the database.
Kubernetes evolved quite a bit while we were busy babysitting our state files. It stopped being just a container orchestrator and started trying to run the whole house. Every major cloud provider released their own Kubernetes operator. Suddenly, you could manage a storage bucket or a database directly from inside your cluster. But there was a catch. The operators refused to speak to each other. You essentially hired a team of brilliant specialists who absolutely hate each other.
This is exactly where Crossplane steps in to act as the universal, unbothered therapist for your infrastructure.
Meet your new obsessive infrastructure butler
Crossplane does not care about vendor rivalries. It installs itself into your Kubernetes cluster and uses the native Kubernetes reconciliation loop to manage your external cloud resources.
If you are unfamiliar with the reconciliation loop, think of it as an aggressively helpful, obsessive-compulsive butler. You hand this butler a piece of YAML paper stating that you require a specific storage bucket in a specific region. The butler goes out, builds the bucket, and then stands there staring at it forever. If a rogue developer logs into the cloud console and manually deletes that bucket, the butler simply builds it again before the developer has even finished their morning coffee. It is relentless, slightly unnerving, and exactly what you want to keep your infrastructure in check.
Because Crossplane lives inside Kubernetes, you do not need to run a separate pipeline just to execute an infrastructure plan. The cluster itself is the engine. You declare what you want, and the cluster makes reality match your desires.
The anatomy of a multi-cloud combo meal
To understand how this actually works without getting bogged down in endless documentation, you only need to understand three main concepts.
First, you have Providers. These are the translator modules. You install the AWS Provider, the Azure Provider, or the Google Cloud Provider, and suddenly your Kubernetes cluster knows how to speak their specific dialects.
Next, you have Managed Resources. These are the raw ingredients. A single virtual machine, a single virtual network, or a single database instance. You can deploy these directly, but asking a developer to configure twenty different Managed Resources just to get a working application is like handing them a live chicken, a sack of flour, and telling them to make a sandwich.
This brings us to the real magic of Crossplane, which is the Composite Resource.
Composite Resources allow you to bundle all those raw ingredients into a single, easy-to-digest package. It is the infrastructure equivalent of a fast-food drive-through. A developer does not need to know about subnets, security groups, or routing tables. They just submitted a claim for a “Standard Web Database” value meal. Crossplane takes that simple request and translates it into the complex web of resources required behind the scenes.
Looking at the code without falling asleep
To prove that this is not just theoretical nonsense, let us look at what it takes to command two completely different cloud providers from the exact same place.
Normally, doing this requires switching between different tools, authenticating multiple times, and praying you do not execute the wrong command in the wrong terminal. With Crossplane, you just throw your YAML files into the cluster.
Here is a sanitized, totally harmless example of how you might ask AWS for a storage bucket.
And right next to it, in the exact same directory, you can drop this snippet to demand a Resource Group from Azure.
apiVersion: azure.upbound.io/v1beta1
kind: ResourceGroup
metadata:
  name: rg-marketing-dev-01
spec:
  forProvider:
    location: West Europe
  providerConfigRef:
    name: azure-default-provider
You apply these manifests, and Crossplane handles the authentication, the API calls, and the aggressive babysitting of the resources. No Terraform state file is required. It is completely stateless GitOps magic.
The ugly truth about operating at scale
Of course, getting rid of the state file is like going to a music festival without a cell phone. It sounds incredibly liberating until you lose your friends and cannot find your way home.
Operating Crossplane at scale is not always a walk in the park. When things go wrong during provisioning, and they absolutely will go wrong, you do not get a neatly formatted error summary. Because there is no central state file to reference, finding out why a resource failed requires interrogating the Kubernetes API directly.
You type a command to check the status of your resources, and the cluster vomits a massive wall of text onto your screen. It is like trying to find a typo in a phone book while someone shouts at you in a foreign language. Running multiple kubectl commands just to figure out why an Azure database refused to spin up gets very old, very fast.
To survive this chaos, you cannot rely on manual terminal commands. You must pair Crossplane with a dedicated GitOps tool like ArgoCD or FluxCD.
These tools act as the adult in the room. They keep track of what was actually deployed, provide a visual dashboard, and translate the cluster’s internal panic into something a human being can actually read. They give you the visibility that Crossplane lacks out of the box.
Ultimately, moving to Crossplane is a paradigm shift. It requires letting go of the comfortable, procedural workflows of traditional infrastructure as code and embracing the chaotic, eventual consistency of Kubernetes. It has a learning curve that might make you pull your hair out initially, but once you set up your Composite Resources and your GitOps pipelines, you will never want to go back to juggling state files again.
Static service account keys have an odd domestic quality to them. They begin life as a sensible convenience and, after a few months, end up tucked into variable groups, copied into wikis, or lurking in a repository with the innocent menace of a spare house key under a flowerpot. They work, certainly. So does leaving your front door on the latch. The problem is not whether it works. The problem is how long you can keep pretending it is a good idea.
This article shows how to let Azure DevOps authenticate to Google Cloud without creating or storing a long-lived service account key. Instead, Azure DevOps presents a short-lived OIDC token, Google Cloud checks that token against a workload identity provider, and the pipeline receives temporary Google credentials only for the duration of the job.
The result is cleaner, safer, and far less likely to produce the sort of sentence nobody enjoys reading in a postmortem, namely, “we found an old credential in a place that should not have contained a credential.”
Why this setup is worth the trouble
The old pattern is familiar. You create a Google Cloud service account, download a JSON key, store it somewhere “temporary”, and then spend the next year hoping nobody has copied it into four other places. Even if the key never leaks, it still becomes one more secret to rotate, one more thing to explain to auditors, and one more awkward dependency between your pipeline and a file that should not really exist.
Workload Identity Federation replaces that with short-lived trust. Azure DevOps proves who it is at runtime. Google Cloud verifies that proof. No static key is issued, no secret needs to be rotated, and there is much less housekeeping disguised as security.
Strictly speaking, you can grant permissions directly to the federated principal in Google Cloud. In this article, I am using service account impersonation instead. It is a little easier to reason about, it fits neatly with how many teams already model CI identities, and it behaves consistently across a wide range of Google Cloud services.
What is actually happening
Under the hood, the flow is less mystical than it first appears.
Azure DevOps has a service connection that can mint an OIDC ID token for the running pipeline. Google Cloud has a workload identity pool and an OIDC provider configured to trust tokens issued by that Azure DevOps organization. When the pipeline runs, it retrieves the token, writes a small credential configuration file, and uses that file to exchange the token for temporary Google credentials. Those credentials are then used to impersonate a Google Cloud service account with the exact roles needed for the job.
If you prefer a more ordinary analogy, think of it as a reception desk in an office building. Azure DevOps arrives with a temporary visitor badge. Google Cloud checks whether the badge was issued by a reception desk it trusts, whether it belongs to the expected visitor, and whether that visitor is allowed through the next door. If all of that checks out, access is granted for a while and then expires. Nobody hands over the master keys to the building.
Preparing Azure DevOps
The Azure DevOps side is simpler than it first looks, although the menus do their best to suggest otherwise.
Create an Azure Resource Manager service connection in your Azure DevOps project and use these settings:
Identity type: App registration (automatic)
Credential: Workload identity federation
Scope level: Subscription
Yes, you still need to select a subscription even if your real destination is Google Cloud. It feels slightly like being asked for your train ticket while boarding a ferry, but that is the supported path.
Once the service connection is saved, note down two values from the Workload Identity federation details section:
Issuer
Subject identifier
The issuer identifies your Azure DevOps organization. The subject identifier identifies the service connection. In practice, the subject identifier follows this pattern:
That detail matters because Google Cloud will ultimately trust this specific identity, not merely “some pipeline from somewhere in the general direction of Azure.”
A practical naming note is worth making here. Choose a stable, descriptive service connection name early. Renaming things later is always possible in the same way as replacing the plumbing in a bathroom is possible. The word possible is doing quite a lot of work.
Teaching Google Cloud to trust Azure DevOps
Now we move to Google Cloud, where the important trick is to trust the right thing in the right way.
Create a dedicated workload identity pool and OIDC provider. You can do this from the console, but the CLI version is easier to keep, review, and repeat.
There are two details here that are easy to get wrong.
First, the allowed audience for the provider is “api://AzureADTokenExchange”. It is not a random per-connection UUID, and it is not the audience string that later appears inside the external account credential file used by the pipeline.
Second, the attribute mapping should not map “google.subject” to “assertion.aud”. For Azure DevOps, the supported workaround for the 127 byte subject limit is to extract the service connection portion from the “sub” claim:
This matters because the raw Azure DevOps subject can be too long for “google.subject”. Extracting the useful part solves the length issue neatly and still gives Google Cloud a stable subject to authorize.
You do not need an attribute condition for Azure DevOps. The issuer is already tenant-specific, which keeps this case pleasantly less dramatic than some other CI systems.
Creating the service account
Next, create the Google Cloud service account that your pipeline will impersonate.
The exact roles depend on what your pipeline needs to do. If the job only uploads artifacts to Cloud Storage, grant a storage role and stop there. If it deploys Cloud Run services, grant the Cloud Run roles it genuinely needs. This is one of those rare moments in cloud engineering where restraint is both morally admirable and operationally useful.
Here is a simple example:
export DEPLOY_PROJECT_ID="acme-observability-dev"
export SERVICE_ACCOUNT_NAME="ci-deployer"
export SERVICE_ACCOUNT_EMAIL="${SERVICE_ACCOUNT_NAME}@${DEPLOY_PROJECT_ID}.iam.gserviceaccount.com"
export FEDERATED_SUBJECT="your-organization/your-project/your-service-connection"

# Create the service account

gcloud iam service-accounts create "$SERVICE_ACCOUNT_NAME" \
  --project="$DEPLOY_PROJECT_ID" \
  --display-name="CI deployer for Azure DevOps"

# Grant only the roles your pipeline really needs

gcloud projects add-iam-policy-binding "$DEPLOY_PROJECT_ID" \
  --member="serviceAccount:${SERVICE_ACCOUNT_EMAIL}" \
  --role="roles/storage.objectAdmin"

# Allow the federated Azure DevOps identity to impersonate the service account

gcloud iam service-accounts add-iam-policy-binding "$SERVICE_ACCOUNT_EMAIL" \
  --project="$DEPLOY_PROJECT_ID" \
  --role="roles/iam.workloadIdentityUser" \
  --member="principal://iam.googleapis.com/projects/${IDENTITY_PROJECT_NUMBER}/locations/global/workloadIdentityPools/${POOL_ID}/subject/${FEDERATED_SUBJECT}"
The “FEDERATED_SUBJECT” value must match the subject produced by your attribute mapping. In plain English, that means the service connection identity that Google Cloud should trust. If the pool lives in one project and the service account lives in another, that is fine, but be careful to use the project number of the identity project in the principal URI.
Building the pipeline
Now for the part everyone actually came for.
The pipeline below uses the AzureCLI task to obtain the Azure DevOps OIDC token, stores it in a temporary file, writes an external account credential file for Google Cloud, signs in with “gcloud”, and then runs a test command.
A couple of details are doing more work here than they appear to be doing.
“addSpnToEnvironment: true” is essential. Without it, the task does not expose the “idToken” variable to your script. The pipeline then behaves like a very polite person who has shown up for an exam without bringing a pen.
The “audience” inside the generated JSON file is also important. This is the full resource name of the workload identity provider in Google Cloud. It is not the same thing as the allowed audience configured on the provider itself. The two values serve different purposes, which is perfectly reasonable once you know it and deeply annoying before you do.
An alternative credential file approach
If you prefer to generate the configuration file with “gcloud” rather than writing JSON inline, you can do that too:
That version is perfectly serviceable and often a little tidier if you dislike heredocs. I have shown the explicit JSON version in the main pipeline because it makes each moving part visible, which is useful while learning or troubleshooting.
Common pitfalls
There are a few places where people lose an afternoon.
The token exists, but the pipeline still fails
Make sure the AzureCLI task is using the correct service connection and that “addSpnToEnvironment” is enabled. If “$idToken” is empty, the problem is usually on the Azure DevOps side, not in Google Cloud.
The principal binding looks right, but impersonation is denied
Check the project number in the principal URI. It must be the project number that owns the workload identity pool, not necessarily the project where the service account lives.
Also, check the federated subject. Because of the attribute mapping, the subject is the extracted service connection path, not the raw OIDC subject, and not a made-up shorthand invented during a stressful coffee break.
The pipeline freezes on an authentication prompt
Use ‘–quiet’ with ‘gcloud auth login’ and similar commands. CI jobs are many things, but conversationalists they are not.
Hosted agents are not available
If your Azure DevOps organization has not yet been granted hosted parallelism, use a self-hosted agent temporarily. In that case, make sure the machine already has ‘az’ and ‘gcloud’ installed and available on the ‘PATH’.
A minimal self-hosted pool declaration looks like this:
pool:
  name: 'Default'
On Windows, remember to switch the script type to PowerShell or PowerShell Core and adjust the environment variable syntax accordingly.
Leaving the keys behind
This setup removes one of the more tiresome habits of cross-cloud automation, namely, manufacturing a secret only to spend the rest of its natural life protecting it from yourself. Azure DevOps can obtain a short-lived token, Google Cloud can verify it, and your pipeline can impersonate a tightly scoped service account without anybody downloading a JSON key and promising to delete it later.
That is the technical benefit. The practical benefit is even nicer. Once this is in place, your pipeline starts to feel less like a cupboard full of labelled jars, some of which may or may not contain explosives, and more like a system that knows who it is, proves it when asked, and then gets on with the job.
Which, in cloud engineering, is about as close as one gets to elegance.
Look at the calendar. It is March 2026. The deadline we have been hearing about for months has officially arrived, and across the globe, engineers are clutching their coffee mugs, staring at their terminals, and waiting for their Kubernetes clusters to spontaneously combust. There is a palpable panic in the air. Tech forums are overflowing with dramatic declarations that the internet is broken, all because a specific piece of software is officially retiring.
Take a deep breath. Your servers are not going to melt. Traffic is not going to suddenly hit a brick wall. But you do need to pack up your things and move, because the building you are living in just fired its maintenance staff.
To understand how we got here and how to get out alive, we need to stop treating this retirement like a digital Greek tragedy and start looking at it like a mundane eviction notice. We are going to peel back the layers of this particular onion, dry our eyes, and figure out how to migrate our traffic routing without breaking a sweat.
The great misunderstanding of what is actually dying
Before we start packing boxes, we need to address the rampant identity confusion that has turned a routine software lifecycle event into a source of mass hysteria. A lot of online discussion has mixed up three entirely different things, treating them like a single, multi-headed beast. Let us separate them.
First, there is NGINX. This is the web server and reverse proxy that has been moving packets around the internet since you were still excited about flip phones. NGINX is fine. Nobody is retiring NGINX. It is healthy, wealthy, and continues to route a massive chunk of the global internet.
Second, there is the Ingress API. This is the Kubernetes object you use to describe your HTTP and HTTPS routing rules. It is just a set of instructions. The Ingress API is not being removed. The Kubernetes maintainers are not going to sneak into your cluster at night and delete your YAML files.
Finally, there is the Ingress NGINX controller. This is the community-maintained piece of software that reads your Ingress API instructions and configures NGINX to actually execute them. This specific controller, maintained by a group of incredibly exhausted volunteers, is the thing that is retiring. As of right now, March 2026, it is no longer receiving updates, bug fixes, or security patches.
That distinction avoids most of the confusion. The bouncer at the door of your nightclub is retiring, but the nightclub itself is still open, and the rules of who gets in remain the same. You just need to hire a new bouncer.
Why the bouncer finally walked off the job
To understand why the community Ingress NGINX controller is packing its bags, you have to look at what we forced it to do. For years, this controller has been the stoic bouncer at the entrance of your Kubernetes cluster. It stood in the rain, checked the TLS certificates, and decided which request got into the VIP pod and which one got thrown out into the alley.
But the Ingress API itself was fundamentally limited. It only understood the basics. It knew about hostnames and paths, but it had no idea how to handle anything complex, like weighted canary deployments, custom header manipulation, or rate limiting.
Because we developers are needy creatures who demand complex routing, we found a workaround. We started using annotations. We slapped sticky notes all over the bouncer’s forehead. We wrote cryptic instructions on these notes, telling the controller to inject custom configuration snippets directly into the underlying NGINX engine.
Eventually, the bouncer was walking around completely blinded by thousands of contradictory sticky notes. Maintaining this chaotic system became a nightmare for the open-source volunteers. They were basically performing amateur dental surgery in the dark, trying to patch security holes in a system entirely built out of user-injected string workarounds. The technical debt became a mountain, and the maintainers rightly decided they had had enough.
The terrifying reality of unpatched edge components
If the controller is not going to suddenly stop working today, you might be tempted to just leave it running. This is a terrible idea.
Leaving an obsolete, unmaintained Ingress controller facing the public internet is exactly like leaving the front door of your house under the strict protection of a scarecrow. The crows might stay away for the first week. But eventually, the local burglars will realize your security system is made of straw and old clothes.
Edge proxies are the absolute favorite targets for attackers. They sit right on the boundary between the wild, unfiltered internet and your soft, vulnerable application data. When a new vulnerability is discovered next month, there will be no patch for your retired Ingress NGINX controller. Attackers will scan the internet for that specific outdated signature, and they will walk right past your scarecrow. Do not be the person explaining to your boss that the company data was stolen because you did not want to write a few new YAML files.
Meet the new security firm known as Gateway API
If Ingress was a single bouncer overwhelmed by sticky notes, the new standard, known as Gateway API, is a professional security firm with distinct departments.
The core problem with Ingress was that it forced the infrastructure team and the application developers to fight over the same file. The platform engineer wanted to manage the TLS certificates, while the developer just wanted to route traffic to their new shopping cart service.
Gateway API fixes this by splitting the responsibilities into different objects. You have a GatewayClass (the type of security firm), a Gateway (the physical building entrance managed by the platform team), and an HTTPRoute (the specific room VIP lists managed by the developers). It is structured, it is typed, and most importantly, it drastically reduces the need for those horrible annotation sticky notes.
You do not have to migrate to the Gateway API. You can simply switch to a different, commercially supported Ingress controller that still reads your old files. But if you are going to rip off the bandage and change your routing infrastructure, you might as well upgrade to the modern standard.
A before-and-after infomercial for your YAML files
Let us look at a practical example. Has this ever happened to you? Are your YAML files bloated, confusing, and causing you physical pain to read? Look at this disastrous piece of legacy Ingress configuration.
This is not a configuration. This is a hostage note. You are begging the controller to understand regex rewrites and canary deployments by passing simple strings through annotations.
Now, wipe away those tears and look at the clean, structured beauty of an HTTPRoute in the Gateway API world.
Look at that. No sticky notes. No injected server snippets. The routing weights and the URL rewrites are native, structured fields. Your linter can actually read this and tell you if you made a typo before you deploy it and take down the entire production environment.
A twelve-step rehabilitation program for your cluster
You cannot just delete the old controller on a Friday afternoon and hope for the best. You need a controlled rehabilitation program for your cluster. Treat this as a serious infrastructure project.
Phase 1: The honest inventory
You need to look at yourself in the mirror and figure out exactly what you have deployed. Find every single Ingress object in your cluster. Document every bizarre annotation your developers have added over the years. You will likely find routing rules for services that were decommissioned three years ago.
Phase 2: Choosing your new guardian
Evaluate the replacements. If you want to stick with NGINX, look at the official F5 NGINX Ingress Controller. If you want something modern, look at Envoy-based solutions like Gateway API implementations from Cilium, Istio, or Contour. Deploy your choice into a sandbox environment.
Phase 3: The great translation
Start converting those sticky notes. Take your legacy Ingress objects and translate them into Gateway API routes, or at least clean them up for your new controller. This is the hardest part. You will have to decipher what nginx.ingress.kubernetes.io/configuration-snippet actually does in your specific context.
Phase 4: The side-by-side test
Run the new controller alongside the retiring community one. Use a test domain. Throw traffic at it. Watch the metrics. Ensure that your monitoring dashboards and alerting rules still work, because the new controller will expose entirely different metric formats.
Phase 5: The DNS switch
Slowly move your DNS records from the old load balancer to the new one. Do this during business hours when everyone is awake and heavily caffeinated, not at 2 AM on a Sunday.
The final word on not panicking
If you need a message to send to your management team today, keep it simple. Tell them the community ingress-nginx controller is now officially unmaintained. Assure them the website is not down, but inform them that staying on this software is a ticking security time bomb. You need time and resources to move to a modern implementation.
The real lesson here is not that Kubernetes is unstable. It is that the software world relies heavily on the unpaid labor of open-source maintainers. When a critical project no longer has enough volunteers to hold back the tide of technical debt, responsible engineering teams do not sit around complaining on internet forums. They say thank you for the years of free service, they roll up their sleeves, and they migrate before the lack of maintenance becomes an incident report.
Most AWS migrations begin with a noble ambition and a faintly ridiculous problem.
The ambition is to modernise an estate, reduce risk, tidy the architecture, and perhaps, if fortune smiles, stop paying for three things nobody remembers creating.
The ridiculous problem is that before you can migrate anything, you must first work out what is actually there.
That sounds straightforward until you inherit an AWS account with the accumulated habits of several teams, three naming conventions, resources scattered across regions, and the sort of IAM sprawl that suggests people were granting permissions with the calm restraint of a man feeding pigeons. At that point, architecture gives way to archaeology.
I do not work for AWS, and this is not a sponsored love letter to a shiny console feature. I am an AWS and GCP architect working in the industry, and I have used AWSMap when assessing environments ahead of migration work. The reason I am writing about it is simple enough. It is one of those practical tools that solves a very real problem, and somehow remains less widely known than it deserves.
AWSMap is a third-party command-line utility that inventories AWS resources across regions and services, then lets you explore the result through HTML reports, SQL queries, and plain-English questions. In other words, it turns the early phase of a migration from endless clicking into something closer to a repeatable assessment process.
That does not make it perfect, and it certainly does not replace native AWS services. But in the awkward first hours of understanding an inherited environment, it can be remarkably useful.
The migration problem before the migration
A cloud migration plan usually looks sensible on paper. There will be discovery, analysis, target architecture, dependency mapping, sequencing, testing, cutover, and the usual brave optimism seen in project plans everywhere.
In reality, the first task is often much humbler. You are trying to answer questions that should be easy and rarely are.
What is running in this account?
Which regions are actually in use?
Are there old snapshots, orphaned EIPs, forgotten load balancers, or buckets with names that sound important enough to frighten everyone into leaving them alone?
Which workloads are genuinely active, and which are just historical luggage with a monthly invoice attached?
You can answer those questions from the AWS Management Console, of course. Given enough tabs, enough patience, and a willingness to spend part of your afternoon wandering through services you had not planned to visit, you will eventually get there. But that is not a particularly elegant way to begin a migration.
This is where AWSMap becomes handy. Instead of treating discovery as a long guided tour of the console, it treats it as a data collection exercise.
What AWSMap does well
At its core, AWSMap scans an AWS environment and produces an inventory of resources. The current public package description on PyPI describes it as covering more than 150 AWS services, while version 1.5.0 covers 140 plus services, which is a good reminder that the coverage evolves. The important point is not the exact number on a given Tuesday morning, but that it covers a broad enough slice of the estate to be genuinely useful in early assessments.
What makes the tool more interesting is what it does after the scan.
It can generate a standalone HTML report, store results locally in SQLite, let you query the inventory with SQL, run named audit queries, and translate plain-English prompts into database queries without sending your infrastructure metadata off to an LLM service. The release notes for v1.5.0 describe local SQLite storage, raw SQL querying, named queries, typo-tolerant natural language questions, tag filtering, scoped account views, and browsable examples.
That combination matters because migrations are rarely single, clean events. They are usually a series of discoveries, corrections, and mildly awkward conversations. Having the inventory preserved locally means the account does not need to be rediscovered from scratch every time someone asks a new question two days later.
The report you can actually hand to people
One of the surprisingly practical parts of AWSMap is the report output.
The tool can generate a self-contained HTML report that opens locally in a browser. That sounds almost suspiciously modest, but it is useful precisely because it is modest. You can attach it to a ticket, share it with a teammate, or open it during a workshop without building a whole reporting pipeline first. The v1.5.0 release notes describe the report as a single, standalone HTML file with filtering, search, charts, and export options.
That makes it suitable for the sort of migration meeting where someone says, “Can we quickly check whether eu-west-1 is really the only active region?” and you would rather not spend the next ten minutes performing a slow ritual through five console pages.
A simple scan might look like this:
awsmap -p client-prod
If you want to narrow the blast radius a bit and focus on a few services that often matter early in migration discovery, you could do this:
awsmap -p client-prod -s ec2,rds,elb,lambda,iam
And if the account is a thicket of shared infrastructure, tags can help reduce the noise:
That kind of filtering is helpful when the account contains equal parts business workload and historical clutter, which is to say, most real accounts.
Why SQLite is more important than it sounds
The feature I like most is not the report. It is the local SQLite database.
Every scan can be stored locally, so the inventory becomes queryable over time instead of vanishing the moment the terminal output scrolls away. The default local database path is ‘~/.awsmap/inventory.db’, and the scan results from different runs can accumulate there for later analysis.
This changes the character of the tool quite a bit. It stops being a disposable scanner and becomes something closer to a field notebook.
Suppose you scan a client account today, then return to the same work three days later, after someone mentions an old DR region nobody had documented. Without persistence, you start from scratch. With persistence, you ask the database.
That is a much more civilised way to work.
A query for the busiest services in the collected inventory might look like this:
awsmap query "SELECT service, COUNT(*) AS total
FROM resources
GROUP BY service
ORDER BY total DESC
LIMIT 12"
And a more migration-focused query might be something like:
awsmap query "SELECT account, region, service, name
FROM resources
WHERE service IN ('ec2', 'rds', 'elb', 'lambda')
ORDER BY account, region, service, name"
Neither query is glamorous, but migrations are not built on glamour. They are built on being able to answer dull, important questions reliably.
Security and hygiene checks without the acrobatics
AWSMap also includes named queries for common audit scenarios, which is useful for two reasons.
First, most people do not wake up eager to write SQL joins against IAM relationships. Second, migration assessments almost always drift into security checks sooner or later.
The public release notes describe named queries for scenarios such as admin users, public S3 buckets, unencrypted EBS volumes, unused Elastic IPs, and secrets without rotation.
That means you can move from “What exists?” to “What looks questionable?” without much ceremony.
Those are not, strictly speaking, migration-only questions. But they are precisely the kind of questions that surface during migration planning, especially when the destination design is meant to improve governance rather than merely relocate the furniture.
Asking questions in plain English
One of the nicer additions in the newer version is the ability to ask plain-English questions.
That is the sort of feature that normally causes one to brace for disappointment. But here the approach is intentionally local and deterministic. This functionality is a built-in parser rather than an LLM-based service, which means no API keys, no network calls to an external model, and no need to ship resource metadata somewhere mysterious.
That matters in enterprise environments where the phrase “just send the metadata to a third-party AI service” tends to receive the warm reception usually reserved for wasps.
Some examples:
awsmap ask show me lambda functions by region
awsmap ask list databases older than 180 days
awsmap ask find ec2 instances without Owner tag
Even when the exact wording varies, the basic idea is appealing. Team members who do not want to write SQL can still interrogate the inventory. That lowers the barrier for using the tool during workshops, handovers, and review sessions.
Where AWSMap fits next to AWS native services
This is the part worth stating clearly.
AWSMap is useful, but it is not a replacement for AWS Resource Explorer, AWS Config, or every other native mechanism you might use for discovery, governance, and inventory.
AWS Resource Explorer can search across supported resource types and, since 2024, can also discover all tagged AWS resources using the ‘tag:all’ operator. AWS documentation also notes an important limitation for IAM tags in Resource Explorer search.
AWS Config, meanwhile, continues to expand the resource types it can record, assess, and aggregate. AWS has announced multiple additions in 2025 and 2026 alone, which underlines that the native inventory and compliance story is still moving quickly.
So why use AWSMap at all?
Because its strengths are slightly different.
It is local.
It is quick to run.
It gives you a portable HTML report.
It stores results in SQLite for later interrogation.
It lets you query the inventory directly without setting up a broader governance platform first.
That makes it particularly handy in the early assessment phase, in consultancy-style discovery work, or in those awkward inherited environments where you need a fast baseline before deciding what the more permanent controls should be.
The weak points worth admitting
No serious article about a tool should pretend the tool has descended from heaven in perfect condition, so here are the caveats.
First, coverage breadth is not the same thing as universal depth. A tool can support a large number of services and still provide uneven detail between them. That is true of almost every inventory tool ever made.
Second, the quality of the result still depends on the credentials and permissions you use. If your access is partial, your inventory will be partial, and no amount of cheerful HTML will alter that fact.
Third, local storage is convenient, but it also means you should be disciplined about how scan outputs are handled on your machine, especially if you are working with client environments. Convenience and hygiene should remain on speaking terms.
Fourth, for organisation-wide governance, compliance history, managed rules, and native integrations, AWS services such as Config still have an obvious place. AWSMap is best seen as a sharp assessment tool, not a universal control plane.
That is not a criticism so much as a matter of proper expectations.
A practical workflow for migration discovery
If I were using AWSMap at the start of a migration assessment, the workflow would be something like this.
First, run a broad scan of the account or profile you care about.
After that, ask targeted questions in either SQL or plain English.
awsmap ask list load balancers by region
awsmap ask show databases with no backup tag
awsmap query "SELECT region, COUNT(*) AS total
FROM resources
WHERE service='ec2'
GROUP BY region
ORDER BY total DESC"
And finally, keep the HTML report and local inventory as a baseline for later design discussions.
That is where the tool earns its keep. It gives you a reasonably fast, reasonably structured picture of an estate before the migration plan turns into a debate based on memory, folklore, and screenshots in old slide decks.
When the guessing stops
There is a particular kind of misery in cloud work that comes from being asked to improve an environment before anyone has properly described it.
Tools do not eliminate that misery, but some of them reduce it to a more manageable size.
AWSMap is one of those.
It is not the only way to inventory AWS resources. It is not a substitute for native governance services. It is not magic. But it is practical, fast to understand, and surprisingly helpful when the first job in a migration is simply to stop guessing.
That alone makes it worth knowing about.
And in cloud migrations, a tool that helps replace guessing with evidence is already doing better than half the room.
Run ‘kubectl apply -f pod.yaml’ and Kubernetes has the good manners to make it look simple. You hand over a neat little YAML file, press Enter, and for a brief moment, it feels as if you have politely asked the cluster to start a container.
That is not what happened.
What you actually did was file a request with a distributed bureaucracy. Several components now need to validate your paperwork, record your wishes for posterity, decide where your Pod should live, prepare networking and storage, ask a container runtime to do the heavy lifting, and keep watching the whole arrangement in case it misbehaves. Kubernetes is extremely good at hiding all this. It has the same talent as a hotel lobby. Everything looks calm and polished, while somewhere behind the walls, people are hauling luggage, changing sheets, arguing about room allocation, and trying not to let anything catch fire.
This article follows that process from the moment you submit a manifest to the moment the Pod disappears again. To keep the story tidy, I will use a standalone Pod. In real production environments, Pods are usually created by higher-level controllers such as Deployments, Jobs, or StatefulSets. The Pod is still the thing that ultimately gets scheduled and runs, so it remains the most useful unit to study when you want to understand what Kubernetes is really doing.
When you apply this file, the request goes to the Kubernetes API server. That is the front door of the cluster. Nothing important happens without passing through it first.
The API server does more than nod politely and stamp the form. It checks authentication and authorization, validates the object schema, and sends the request through admission control. Admission controllers can modify or reject the request based on policies, quotas, defaults, or security rules. Only when that process is complete does the API server persist the desired state in etcd, the key-value store Kubernetes uses as its source of truth.
At that point, the Pod officially exists as an object in the cluster.
That does not mean it is running.
It means Kubernetes has written down your intentions in a very serious ledger and is now obliged to make reality catch up.
The scheduler looks for a home
Once the Pod exists but has no node assigned, the scheduler takes interest. Its job is not to run the Pod. Its job is to decide where the Pod should run.
This is less mystical than it sounds and more like trying to seat one extra party in a crowded restaurant without blocking the fire exit.
The scheduler first filters out nodes that cannot host the Pod. A node may be ruled out because it lacks CPU or memory, does not match nodeSelector labels, has taints the Pod does not tolerate, violates affinity or anti-affinity rules, or fails other placement constraints.
From the nodes that survive this round of rejection, the scheduler scores the viable candidates and picks one. Different scoring plugins influence the choice, including resource balance and topology preferences. Kubernetes is not asking, “Which node feels lucky today?” It is performing a structured selection process, even if the result arrives so quickly that it looks like instinct.
When the decision is made, the scheduler updates the Pod object with the chosen node.
That is all.
It does not pull images, start containers, mount storage, or wave a wand. It points at a node and says, in effect, “This one. Good luck to everyone involved.”
The kubelet picks up the job
Each node runs an agent called the kubelet. The kubelet watches the API server and notices when a Pod has been assigned to its node.
This is where the abstract promise turns into physical work.
The kubelet reads the Pod specification and starts coordinating with the local container runtime, such as ‘containerd’, to make the Pod real. If there are volumes to mount, secrets to project, environment variables to inject, or images to fetch, the kubelet is the one making sure those steps happen in the correct order.
The kubelet is not glamorous. It is the floor manager. It does not write the policies, it does not choose the table, and it does not get invited to keynote conferences. It simply has to make the plan work on an actual machine with actual limits. That makes it one of the most important components in the whole affair.
The sandbox appears before the containers do
Before your application container starts, Kubernetes prepares a Pod sandbox.
This is one of those wonderfully unglamorous details that turns out to matter a great deal. A Pod is not just “a container.” It is a small execution environment that may contain one or more containers sharing networking and, often, storage.
To build that environment, several things need to happen.
First, the container runtime may need to pull the image from a registry if it is not already cached on the node. This step alone can keep a Pod waiting for longer than people expect, especially when the image is huge, the registry is slow, or somebody has built an image as if hard disk space were a personal insult.
Second, networking must be prepared. Kubernetes relies on a CNI plugin to create the Pod’s network namespace and assign an IP address. All containers in the same Pod share that network namespace, which is why they can communicate over ‘localhost’. This is convenient and occasionally dangerous, much like sharing a flat with someone who assumes every shelf in the fridge belongs to them.
Third, volumes are mounted. If the Pod references ‘emptyDir’, ‘configMap’, ‘secret’, or persistent volumes, those mounts have to be prepared before the containers can use them.
There is also a small infrastructure container, commonly called the ‘pause’ container, whose job is to hold the Pod’s shared namespaces in place. It is not famous, but it is essential. The ‘pause’ container is a bit like the quiet relative at a family gathering who does no storytelling, makes no dramatic entrance, and is nevertheless the reason the chairs are still standing.
Only after this setup is complete can the application containers begin.
Watching the lifecycle from the outside
You can observe part of this process with a few simple commands:
kubectl apply -f pod.yaml
kubectl get pod demo-pod -w
kubectl describe pod demo-pod
The watch output often gives the first visible clue that the cluster is busy doing considerably more than the neatness of YAML would suggest.
A Pod typically moves through a small set of phases:
‘Pending’ means the Pod has been accepted but is still waiting for scheduling, image pulls, volume setup, or other preparation.
‘Running’ means the Pod has been bound to a node and at least one container is running or starting.
‘Succeeded’ means all containers completed successfully and will not be restarted.
‘Failed’ means all containers finished, but at least one exited with an error.
‘Unknown’ means the control plane cannot reliably determine the Pod state, usually because communication with the node has gone sideways.
These phases are useful, but they do not tell the whole story. One of the more common sources of confusion is ‘CrashLoopBackOff’. That is not a Pod phase. It is a container state pattern shown in ‘kubectl get pods’ output when a container keeps crashing, and Kubernetes backs off before trying again.
This matters because people often stare at ‘Running’ and assume everything is fine. Kubernetes, meanwhile, is quietly muttering, “Technically yes, but only in the way a car is technically functional while smoke comes out of the bonnet.”
Running is not the same as ready
Another detail worth understanding is that a Pod can be running without being ready to receive traffic.
This distinction matters in real systems because applications often need a few moments to warm up, load configuration, establish database connections, or otherwise stop acting like startled wildlife.
A readiness probe tells Kubernetes when the container is actually prepared to serve requests. Until that probe succeeds, the Pod should not be considered a healthy backend for a Service.
With this in place, the container may be running, but Kubernetes will wait before routing traffic to it. This is one of those details that prevents very expensive forms of optimism.
Deletion is a polite process until it is not
Now, let us look at the other end of the Pod’s life.
When you run the following command, the Pod does not vanish in a puff of administrative smoke:
kubectl delete pod demo-pod
Instead, the API server marks the Pod for deletion and sets a grace period. The Pod enters a terminating state. The kubelet on the node sees that instruction and begins shutdown.
The normal sequence looks like this:
Kubernetes may first stop sending new traffic to the Pod if it is behind a Service and no longer considered ready.
A ‘preStop’ hook runs if one has been defined.
The kubelet asks the runtime to send ‘SIGTERM’ to the container’s main process.
Kubernetes waits for the grace period, which is ‘30’ seconds by default and controlled by ‘terminationGracePeriodSeconds’.
If the process still refuses to exit, Kubernetes sends ‘SIGKILL’ and ends the discussion.
That grace period exists for good reasons. Applications may need time to flush logs, finish requests, close connections, write buffers, or otherwise clean up after themselves. Production systems tend to appreciate this courtesy.
Here is a small example of a graceful shutdown configuration:
Once the containers stop, Kubernetes cleans up the sandbox, releases network resources, unmounts volumes as needed, and frees the node’s CPU and memory.
If the Pod was managed by a Deployment, a replacement Pod will usually be created to maintain the desired replica count. This is an important point. In Kubernetes, individual Pods are disposable. The desired state is what matters. Pods come and go. The controller remains stubborn.
Why this matters in the real world
Understanding this lifecycle is not trivia for people who enjoy suffering through conference diagrams. It is practical.
If a Pod is stuck in ‘Pending’, you need to know whether the issue is scheduling, image pulling, volume attachment, or policy rejection.
If a container is ‘CrashLoopBackOff’, you need to know that the Pod object exists, has probably been scheduled, and that the failure is happening later in the chain.
If traffic is not reaching the application, you need to remember that ‘Running’ and ‘Ready’ are not the same thing.
If shutdowns are ugly, logs are truncated, or users get errors during rollout, you need to inspect readiness probes, ‘preStop’ hooks, and grace periods rather than blaming Kubernetes in the abstract, which it will survive, but your incident report may not.
This is also where commands like these become genuinely useful:
kubectl get pod demo-pod -o wide
kubectl describe pod demo-pod
kubectl logs demo-pod
kubectl get events --sort-by=.metadata.creationTimestamp
Those commands let you inspect node placement, container events, log output, and recent cluster activity. Most Kubernetes troubleshooting starts by figuring out which stage of the Pod lifecycle has gone wrong, then narrowing the problem from there.
The quiet machinery behind a simple command
The next time you type ‘kubectl apply -f pod.yaml’, it is worth remembering that you are not merely starting a container. You are triggering a chain of decisions and side effects across the control plane and a worker node.
The API server validates and records the request. The scheduler finds a suitable home. The kubelet coordinates the local work. The runtime pulls images and starts containers. The CNI plugin wires up networking. Volumes are mounted. Probes decide whether the Pod is truly ready. And when the time comes, Kubernetes tears the whole thing down with the brisk professionalism of hotel staff clearing a room before the next guest arrives.
Which is impressive, really.
Particularly when you consider that from your side of the terminal, it still looks as though you only asked for one modest little Pod.
Let us talk about healthcare data pipelines. Running high volume payer processing pipelines is a lot like hosting a mandatory potluck dinner for a group of deeply eccentric people with severe and conflicting dietary restrictions. Each payer behaves with maddening uniqueness. One payer bursts through the door, demanding an entire roasted pig, which they intend to consume in three minutes flat. This requires massive, short-lived computational horsepower. Another payer arrives with a single boiled pea and proceeds to chew it methodically for the next five hours, requiring a small but agonizingly persistent trickle of processing power.
On top of this culinary nightmare, there are strict rules of etiquette. You absolutely must digest the member data before you even look at the claims data. Eligibility files must be validated before anyone is allowed to touch the dessert tray of downstream jobs. The workload is not just heavy. It is incredibly uneven and delightfully complicated.
Buying folding chairs for a banquet
On paper, Amazon Web Services managed Auto Scaling Mechanisms should fix this problem. They are designed to look at a growing pile of work and automatically hire more help. But applying generic auto scaling to healthcare pipelines is like a restaurant manager seeing a line out the door and solving the problem by buying fifty identical plastic folding chairs.
The manager does not care that one guest needs a high chair and another requires a reinforced steel bench. Auto scaling reacts to the generic brute force of the system load. It cannot look at a specific payer and tailor the compute shape to fit their weird eating habits. It cannot enforce the strict social hierarchy of job priorities. It scales the infrastructure, but it completely fails to scale the intention.
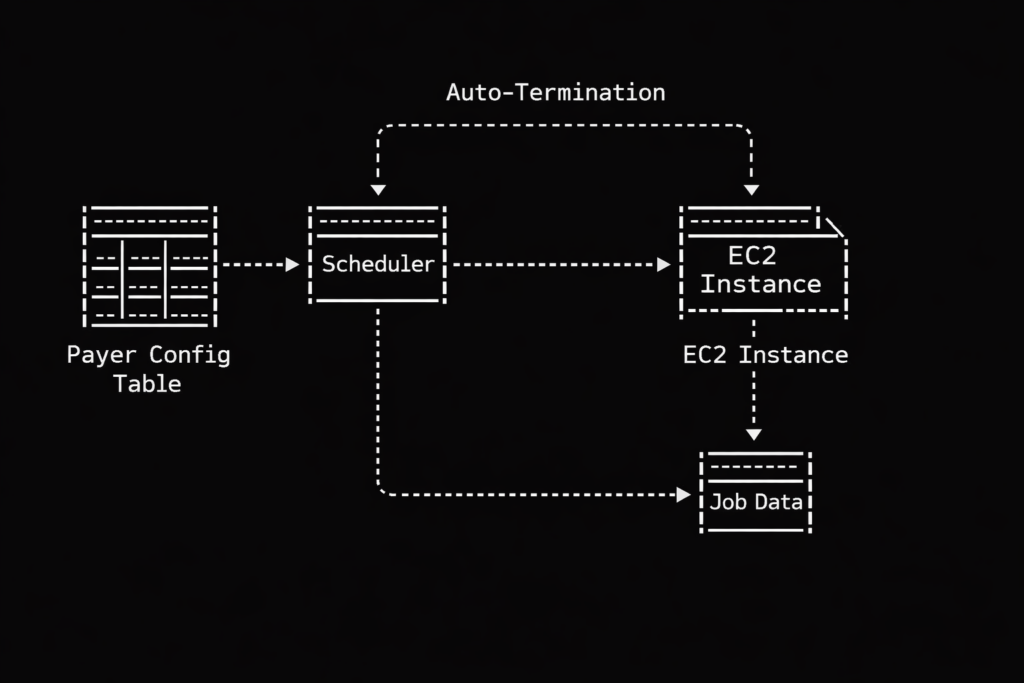
This is why we abandoned the generic approach and built our own dynamic EC2 provisioning system. Instead of maintaining a herd of generic servers waiting around for something to do, we create bespoke servers on demand based on a central configuration table.
The ruthless nightclub bouncer of job scheduling
Let us look at how this actually works regarding prioritization. Our system relies on that central configuration table to dictate order. Think of this table as the guest list at an obnoxiously exclusive nightclub. Our scheduler acts as the ruthless bouncer.
When jobs arrive at the queue, the bouncer checks the list. Member data? Right this way to the VIP lounge, sir. Claims data? Stand on the curb behind the velvet rope until the members are comfortably seated. Generic auto scaling has no native concept of this social hierarchy. It just sees a mob outside the club and opens the front doors wide. Our dynamic approach gives us perfect, tyrannical control over who gets processed first, ensuring our pipelines execute in a beautifully deterministic way. We spin up exactly the compute we specify, exactly when we want it.
Leaving your car running in the garage
Then there is the financial absurdity of warm pools. Standard auto scaling often relies on keeping a baseline of idle instances warm and ready, just in case a payer decides to drop a massive batch of files at two in the morning.
Keeping idle servers running is the technological equivalent of leaving your car engine idling in the closed garage all night just in case you get a sudden craving for a carton of milk at dawn. It is expensive, it is wasteful, and it makes you look a bit foolish when the AWS bill arrives.
Our dynamic system operates with a baseline of zero. We experience one hundred percent burst efficiency because we only pay for the exact compute we use, precisely when we use it. Cost savings happen naturally when you refuse to pay for things that are sitting around doing nothing.
A delightfully brutal server lifecycle
The operational model we ended up with is almost comically simple compared to traditional methods. A generic scaling group requires complex scaling policies, tricky cooldown periods, and endless tweaking of CloudWatch alarms. It is like managing a highly sensitive, moody teenager.
Our dynamic EC2 model is wonderfully ruthless. We create the instance and inject it with a single, highly specific purpose via a startup script. The instance wakes up, processes the healthcare data with absolute precision, and then politely self destructs so it stops billing us. They are the mayflies of the cloud computing world. They live just long enough to do their job, and then they vanish. There are no orphaned instances wandering the cloud.
This dynamic provisioning model has fundamentally altered how we digest payer workloads. We have somehow achieved a weird but perfect holy grail of cloud architecture. We get the granular flexibility of serverless functions, the raw, unadulterated horsepower of dedicated EC2 instances, and the stingy cost efficiency of a pure event-driven design.
If your processing jobs vary wildly from payer to payer, and if you care deeply about enforcing priorities without burning money on idle metal, building a disposable compute army might be exactly what your architecture is missing. We said goodbye to our idle servers, and honestly, we do not miss them at all.
I once held the charmingly idiotic belief that net worth was directly correlated to calorie expenditure. As a younger man staring up at the financial stratosphere where the ultra-high earners floated, I assumed their lives were a relentless marathon of physiological exertion. I pictured CEOs and Senior Architects sweating through their Italian suits, solving quadratic equations while running on treadmills, their cortisol levels permanently redlining as they suffered for every single cent.
It was a comforting delusion because it implied the universe was a meritocracy based on thermodynamics. It suggested that if I just gritted my teeth hard enough and pushed until my vision blurred, the universe would eventually hand me a corner office and a watch that cost more than my first car.
Then I entered the actual workforce and realized that the universe is not fair. Worse than that, it is not even logical. The market does not care about your lactic acid buildup. In fact, there seems to be an inverse relationship between how much your back hurts at the end of the day and how many zeros are on your paycheck.
The thermodynamic lie of manual labor
Consider the holiday season retail worker. If you have ever worked in a shop during December, you know it is less of a job and more of a biological stress test designed by a sadist. You are on your feet for eight hours. You are smiling at people who are actively trying to return a toaster they clearly dropped in a bathtub. You are lifting boxes, dodging frantic shoppers, and absorbing the collective anxiety of a population that forgot to buy gifts until Christmas Eve.
It is physically draining, emotionally taxing, and mentally numbing. By any objective measure of human suffering, it is “hard work.”
And yet the compensation for this marathon of patience is often a number that barely covers the cost of the therapeutic insoles you need to survive the shift. If hard work were the currency of wealth, the person stacking shelves at 2 AM would be buying the yacht. Instead, they are usually the ones waiting for the night bus while the mall owner sleeps soundly in a bed that probably costs more than the worker’s annual rent.
This is the brutal reality of the labor market. We are not paid for the calories we burn. We are not paid for the “effort” in the strict physics sense of work equals force times distance. We are paid based on a much colder, less human metric. We are paid based on how annoying it would be to find someone else to do it.
The lucrative business of sitting very still
Let us look at my current reality as a DevOps engineer and Cloud Architect. My daily caloric burn is roughly equivalent to a hibernating sloth. While a construction worker is dissolving their kneecaps on concrete, I am sitting in an ergonomic chair designed by NASA, getting irrationally upset because my coffee is slightly below optimal temperature.
To an outside observer, my job looks like a scam. I type a few lines of YAML. I stare at a progress bar. I frown at a dashboard. Occasionally, I sigh dramatically to signal to my colleagues that I am doing something very complex with Kubernetes.
And yet the market values this sedentary behavior at a premium. Why?
It is certainly not because typing is difficult. Most people can type. It is not because I am working “harder” than the retail employee. I am definitely not. The reason is fear. Specifically, the fear of what happens when the progress bar turns red.
We are not paid for the typing. We are paid because we are the only ones willing to perform open-heart surgery on a zombie platform while the CEO watches. The ability to stare into the abyss of a crashing production database without vomiting is a rare and expensive evolutionary trait.
Companies do not pay us for the hours when everything is working. They pay us a retainer fee for the fifteen minutes a year when the entire digital infrastructure threatens to evaporate. We are basically insurance policies that drink too much caffeine.
The panic tax
This brings us to the core of the salary misunderstanding. Most technical professionals think they are paid to build things. This is only partially true. We are largely paid to absorb panic.
When a server farm goes dark, the average business manager experiences a visceral fight-or-flight response. They see revenue dropping to zero. They see lawsuits. They see their bonus fluttering away like a moth. The person who can walk into that room, look at the chaos, and say “I know which wire to wiggle” is not charging for the wire-wiggling. They are charging a “Panic Tax.”
The harder the problem is to understand, and the fewer people there are who can stomach the risk of solving it, the higher the tax you can levy.
If your job can be explained to a five-year-old in a single sentence, you are likely underpaid. If your job involves acronyms that sound like a robotic sneeze and requires you to understand why a specific version of a library hates a specific version of an operating system, you are in the money.
You are being paid for the obscurity of your suffering, not the intensity of it.
The golden retriever replacement theory
To understand your true value, you have to look at yourself with the cold, unfeeling eyes of a hiring manager. You have to ask yourself how easy it would be to replace you.
If you are a generalist who works very hard, follows all the rules, and does exactly what is asked, you are a wonderful employee. You are also doomed. To the algorithm of capitalism, a generalist worker is essentially a standard spare part. If you vanish, the organization simply scoops another warm body from the LinkedIn gene pool and plugs it into the socket before the seat gets cold.
However, consider the engineer who manages the legacy authentication system. You know the one. The system was written ten years ago by a guy named Dave who didn’t believe in documentation and is now living in a yurt in Montana. The code is a terrifying plate of spaghetti that somehow processes payments.
The engineer who knows how to keep Dave’s ghost alive is not working “hard.” They might spend four hours a day reading Reddit. But if they leave, the company stops making money. That engineer is difficult to replace.
This is the goal. You do not want to be the shiny new cog that fits perfectly in the machine. You want to be the weird, knobby, custom-forged piece of metal that holds the entire transmission together. You want to be the structural integrity of the department.
This does not mean you should hoard knowledge or refuse to document your work. That makes you a villain, not an asset. It means you should tackle the problems that are so messy, so risky, and so complex that other people are afraid to touch them.
The art of being a delightful bottleneck
There is a nuance here that is often missed. Being difficult to replace does not mean being difficult to work with. There is a specific type of IT professional who tries to create job security by being the “Guru on the Mountain.” They are grumpy, they refuse to explain anything, and they treat every question as a personal insult.
Do not be that person. Companies will tolerate that person for a while, but they will actively plot to replace them. It is a resentment-based retention strategy.
The profitable approach is to be the “Delightful Bottleneck.” You are the only one who can solve the problem, but you are also happy to help. You become the wizard who saves the day, not the troll under the bridge who demands a toll.
When you position yourself as the only person who can navigate the complexity of the cloud architecture, and you do it with a smile, you create a dependency that feels like a partnership. Management stops looking for your replacement and starts looking for ways to keep you happy. That is when the salary negotiations stop being a battle and start being a formality.
Navigating the scarcity market
If you want to increase your salary, stop trying to increase your effort. You cannot physically work harder than a script. You cannot out-process a serverless function. You will lose that battle every time because biology is inefficient.
Instead, focus on lowering your replaceability.
Niche down until it hurts. Find a corner of the cloud ecosystem that makes other developers wince. Learn the tools that are high in demand but low in experts because the documentation is written in riddles. It is not about working harder. It is about positioning yourself in the market where the supply line is thin and the desperation is high.
Look for the “unsexy” problems. Everyone wants to work on the new AI features. It is shiny. It is fun. It is great for dinner party conversation. But because everyone wants to do it, the supply of labor is high.
Fewer people want to work on compliance automation, security governance, or mainframe migration. These tasks are the digital equivalent of plumbing. They are not glamorous. They involve dealing with sludge. But when the toilet backs up, the plumber can charge whatever they want because nobody else wants to touch it.
Final thoughts on leverage
We often confuse motion with progress. We confuse exhaustion with value. We have been trained since school to believe that the student who studies the longest gets the best grade.
The market does not care about your exhaustion. It cares about your leverage.
Leverage comes from specific knowledge. It comes from owning a problem set that scares other people. It comes from being the person who can walk into a room where everyone is panicking and lower the collective blood pressure by simply existing.
Do not grind yourself into dust trying to be the hardest worker in the room. Be the most difficult one to replace. It pays better, and your lower back will thank you for it.
I was staring at our AWS bill at two in the morning, nursing my third cup of coffee, when I realized something that should have been obvious months earlier. We were paying more to distribute our traffic than to process it. Our Application Load Balancer, that innocent-looking service that simply forwards packets from point A to point B, was consuming $3,900 every month. That is $46,800 a year. For a traffic cop. A very expensive traffic cop that could not even handle our peak loads without breaking into a sweat.
The particularly galling part was that we had accepted this as normal. Everyone uses AWS load balancers, right? They are the standard, the default, the path of least resistance. It is like paying rent for an apartment you only use to store your shoes. Technically functional, financially absurd.
So we did what any reasonable engineering team would do at that hour. We started googling. And that is how we discovered IPVS, a technology so old that half our engineering team had not been born when it was first released. IPVS stands for IP Virtual Server, which sounds like something from a 1990s hacker movie, and honestly, that is not far off. It was written in 1998 by a fellow named Wensong Zhang, who presumably had no idea that twenty-eight years later, a group of bleary-eyed engineers would be using his code to save more than forty-six thousand dollars a year.
The expensive traffic cop
To understand why we were so eager to jettison our load balancer, you need to understand how AWS pricing works. Or rather, how it accumulates like barnacles on the hull of a ship, slowly dragging you down until you wonder why you are moving so slowly.
An Application Load Balancer costs $0.0225 per hour. That sounds reasonable, about sixteen dollars a month. But then there are LCUs, or Load Balancer Capacity Units, which charge you for every new connection, every rule evaluation, every processed byte. It is like buying a car and then discovering you have to pay extra every time you turn the steering wheel.
In practice, this meant our ALB was consuming fifteen to twenty percent of our entire infrastructure budget. Not for compute, not for storage, not for anything that actually creates value. Just for forwarding packets. It was the technological equivalent of paying a butler to hand you the remote control.
The ALB also had some architectural quirks that made us scratch our heads. It terminated TLS, which sounds helpful until you realize we were already terminating TLS at our ingress. So we were decrypting traffic, then re-encrypting it, then decrypting it again. It was like putting on a coat to go outside, then taking it off and putting on another identical coat, then finally going outside. The security theater was strong with this one.
A trip to 1999
I should confess that when we started this project, I had no idea what IPVS even stood for. I had heard it mentioned in passing by a colleague who used to work at a large Chinese tech company, where apparently everyone uses it. He described it with the kind of reverence usually reserved for vintage wine or classic cars. “It just works,” he said, which in engineering terms is the highest possible praise.
IPVS, I learned, lives inside the Linux kernel itself. Not in a container, not in a microservice, not in some cloud-managed abstraction. In the actual kernel. This means when a packet arrives at your server, the kernel looks at it, consults its internal routing table, and forwards it directly. No context switches, no user-space handoffs, no “let me ask my manager” delays. Just pure, elegant packet forwarding.
The first time I saw it in action, I felt something I had not felt in years of cloud engineering. I felt wonder. Here was code written when Bill Clinton was president, when the iPod was still three years away, when people used modems to connect to the internet. And it was outperforming a service that AWS charges thousands of dollars for. It was like discovering that your grandfather’s pocket watch keeps better time than your smartwatch.
How the magic happens
Our setup is almost embarrassingly simple. We run a DaemonSet called ipvs-router on dedicated, tiny nodes in each Availability Zone. Each pod does four things, and it does them with the kind of efficiency that makes you question everything else in your stack.
First, it claims an Elastic IP using kube-vip, a CNCF project that lets Kubernetes pods take ownership of spare EIPs. No AWS load balancer required. The pod simply announces “this IP is mine now”, and the network obliges. It feels almost rude how straightforward it is.
Second, it programs IPVS in the kernel. IPVS builds an L4 load-balancing table that forwards packets at line rate. No proxies, no user-space hops. The kernel becomes your load balancer, which is a bit like discovering your car engine can also make excellent toast. Unexpected, but delightful.
Third, it syncs with Kubernetes endpoints. A lightweight controller watches for new pods, and when one appears, IPVS adds it to the rotation in less than a hundred milliseconds. Scaling feels instantaneous because, well, it basically is.
But the real trick is the fourth thing. We use something called Direct Server Return, or DSR. Here is how it works. When a request comes in, it travels from the client to IPVS to the pod. But the response goes directly from the pod back to the client, bypassing the load balancer entirely. The load balancer never sees response traffic. That is how we get ten times the throughput. It is like having a traffic cop who only directs cars into the city but does not care how they leave.
The code that makes it work
Here is what our DaemonSet looks like. I have simplified it slightly for readability, but this is essentially what runs in our production cluster:
The key here is hostNetwork: true, which gives the pod direct access to the host’s network stack. Combined with the NET_ADMIN capability, this allows IPVS to manipulate the kernel’s routing tables directly. It requires a certain level of trust in your containers, but then again, so does running a load balancer in the first place.
We also use a custom controller to sync Kubernetes endpoints with IPVS. Here is the core logic:
# Simplified endpoint sync logic
def sync_endpoints(service_name, namespace):
    # Get current endpoints from Kubernetes
    endpoints = k8s_client.list_namespaced_endpoints(
        namespace=namespace,
        field_selector=f""metadata.name={service_name}""
    )

    # Extract pod IPs
    pod_ips = []
    for subset in endpoints.items[0].subsets:
        for address in subset.addresses:
            pod_ips.append(address.ip)

    # Build IPVS rules using ipvsadm
    for ip in pod_ips:
        subprocess.run([
            ""ipvsadm"", ""-a"", ""-t"",
            f""{VIP}:443"", ""-r"", f""{ip}:443"", ""-g""
        ])

    # The -g flag enables Direct Server Return (DSR)
    return len(pod_ips)
The numbers that matter
Let me tell you about the math, because the math is almost embarrassing for AWS. Our old ALB took about five milliseconds to set up a new connection. IPVS takes less than half a millisecond. That is not an improvement. That is a different category of existence. It is the difference between walking to the shops and being teleported there.
While our ALB would start getting nervous around one hundred thousand concurrent connections, IPVS just does not. It could handle millions. The only limit is how much memory your kernel has, which in our case meant we could have hosted the entire internet circa 2003 without breaking a sweat.
In terms of throughput, our ALB topped out around 2.5 gigabits per second. IPVS saturates the 25-gigabit NIC on our c7g.medium instances. That is ten times the throughput, for those keeping score at home. The load balancer stopped being the bottleneck, which was refreshing because previously it had been like trying to fill a swimming pool through a drinking straw.
But the real kicker is the cost. Here is the breakdown. We run one c7g.medium spot instance per availability zone, three zones total. Each costs about $0.017 per hour. That is $0.051 per hour for compute. We also have three Elastic IPs at $0.005 per hour each, which is $0.015 per hour. With Direct Server Return, outbound transfer costs are effectively zero because responses bypass the load balancer entirely.
The total? A mere $0.066 per hour. Divide that among three availability zones, and you’re looking at roughly $0.009 per hour per zone. That’s nine-tenths of a cent per hour. Let’s not call it optimization, let’s call it a financial exorcism. We went from shelling out $3,900 a month to a modest $48. The savings alone could probably afford a very capable engineer’s caffeine habit.
But what about L7 routing
At this point, you might be raising a valid objection. IPVS is dumb L4. It does not inspect HTTP headers, it does not route based on gRPC metadata, and it does not care about your carefully crafted REST API conventions. It just forwards packets based on IP and port. It is the postal worker of the networking world. Reliable, fast, and utterly indifferent to what is in the envelope.
This is where we layer in Envoy, because intelligence should live where it makes sense. Here is how the request flow works. A client connects to one of our Elastic IPs. IPVS forwards that connection to a random healthy pod. Inside that pod, an Envoy sidecar inspects the HTTP/2 headers or gRPC metadata and routes to the correct internal service.
The result is L4 performance at the edge and L7 intelligence at the pod. We get the speed of kernel-level packet forwarding combined with the flexibility of modern service mesh routing. It is like having a Formula 1 engine in a car that also has comfortable seats and a good sound system. Best of both worlds. Our Envoy configuration looks something like this:
I should mention that our first attempt did not go smoothly. In fact, it went so poorly that we briefly considered pretending the whole thing had never happened and going back to our expensive ALBs.
The problem was DNS. We pointed our api.ourcompany.com domain at the new Elastic IPs, and then we waited. And waited. And nothing happened. Traffic was still going to the old ALB. It turned out that our DNS provider had a TTL of one hour, which meant that even after we updated the record, most clients were still using the old IP address for, well, an hour.
But that was not the real problem. The real problem was that we had forgotten to update our health checks. Our monitoring system was still pinging the old ALB’s health endpoint, which was now returning 404s because we had deleted the target group. So our alerts were going off, our pagers were buzzing, and our on-call engineer was having what I can only describe as a difficult afternoon.
We fixed it, of course. Updated the health checks, waited for DNS to propagate, and watched as traffic slowly shifted to the new setup. But for about thirty minutes, we were flying blind, which is not a feeling I recommend to anyone who values their peace of mind.
Deploying this yourself
If you are thinking about trying this yourself, the good news is that it is surprisingly straightforward. The bad news is that you will need to know your way around Kubernetes and be comfortable with the idea of pods manipulating kernel networking tables. If that sounds terrifying, perhaps stick with your ALB. It is expensive, but it is someone else’s problem.
Here is the deployment process in a nutshell. First, deploy the DaemonSet. Then allocate some spare Elastic IPs in your subnet. There is a particular quirk in AWS networking that can ruin your afternoon: the source/destination check. By default, EC2 instances are configured to reject traffic that does not match their assigned IP address. Since our setup explicitly relies on handling traffic for IP addresses that the instance does not technically ‘own’ (our Virtual IPs), AWS treats this as suspicious activity and drops the packets. You must disable the source/destination check on any instance running these router pods. It is a simple checkbox in the console, but forgetting it is the difference between a working load balancer and a black hole. The pods will auto-claim them using kube-vip. Also, ensure your worker node IAM roles have permission to reassociate Elastic IPs, or your pods will shout into the void without anyone listening. Update your DNS to point at the new IPs, using latency-based routing if you want to be fancy. Then watch as your ALB target group drains, and delete the ALB next week after you are confident everything is working.
The whole setup takes about three hours the first time, and maybe thirty minutes if you do it again. Three hours of work for $46,000 per year in savings. That is $15,000 per hour, which is not a bad rate by anyone’s standards.
What we learned about Cloud computing
Three months after we made the switch, I found myself at an AWS conference, listening to a presentation about their newest managed load balancing service. It was impressive, all machine learning and auto-scaling and intelligent routing. It was also, I calculated quietly, about four hundred times more expensive than our little IPVS setup.
I did not say anything. Some lessons are better learned the hard way. And as I sat there, sipping my overpriced conference coffee, I could not help but smile.
AWS managed services are built for speed of adoption and lowest-common-denominator use cases. They are not built for peak efficiency, extreme performance, or cost discipline. For foundational infrastructure like load balancing, a little DIY unlocks exponential gains.
The embarrassing truth is that we should have done this years ago. We were so accustomed to reaching for managed services that we never stopped to ask whether we actually needed them. It took a 2 AM coffee-fueled bill review to make us question the assumptions we had been carrying around.
Sometimes the future of cloud computing looks a lot like 1999. And honestly, that is exactly what makes it beautiful. There is something deeply satisfying about discovering that the solution to your expensive modern problem was solved decades ago by someone working on a much simpler internet, with much simpler tools, and probably much more sleep.
Wensong Zhang, wherever you are, thank you. Your code from 1998 is still making engineers happy in 2026. That is not a bad legacy for any piece of software.
The author would like to thank his patient colleagues who did not complain (much) during the DNS propagation incident, and the kube-vip maintainers who answered his increasingly desperate questions on Slack.
I have spent the better part of three years wrestling with Google Cloud Platform, and I am still not entirely convinced it wasn’t designed by a group of very clever people who occasionally enjoy a quiet laugh at the rest of us. The thing about GCP, you see, is that it works beautifully right up until the moment it doesn’t. Then it fails with such spectacular and Byzantine complexity that you find yourself questioning not just your career choices but the fundamental nature of causality itself.
My first encounter with Cloud Build was typical of this experience. I had been tasked with setting up a CI/CD pipeline for a microservices architecture, which is the modern equivalent of being told to build a Swiss watch while someone steadily drops marbles on your head. Jenkins had been our previous solution, a venerable old thing that huffed and puffed like a steam locomotive and required more maintenance than a Victorian greenhouse. Cloud Build promised to handle everything serverlessly, which is a word that sounds like it ought to mean something, but in practice simply indicates you won’t know where your code is running and you certainly won’t be able to SSH into it when things go wrong.
The miracle, when it arrived, was decidedly understated. I pushed some poorly written Go code to a repository and watched as Cloud Build sprang into life like a sleeper agent receiving instructions. It ran my tests, built a container, scanned it for vulnerabilities, and pushed it to storage. The whole process took four minutes and cost less than a cup of tea. I sat there in my home office, the triumph slowly dawning, feeling rather like a man who has accidentally trained his cat to make coffee. I had done almost nothing, yet everything had happened. This is the essential GCP magic, and it is deeply unnerving.
The vulnerability scanner is particularly wonderful in that quietly horrifying way. It examines your containers and produces a list of everything that could possibly go wrong, like a pilot’s pre-flight checklist written by a paranoid witchfinder general. On one memorable occasion, it flagged a critical vulnerability in a library I wasn’t even aware we were using. It turned out to be nested seven dependencies deep, like a Russian doll of potential misery. Fixing it required updating something else, which broke something else, which eventually led me to discover that our entire authentication layer was held together by a library last maintained in 2018 by someone who had subsequently moved to a commune in Oregon. The scanner was right, of course. It always is. It is the most anxious and accurate employee you will ever meet.
Google Kubernetes Engine or how I learned to stop worrying and love the cluster
If Cloud Build is the efficient butler, GKE is the robot overlord you find yourself oddly grateful to. My initial experience with Kubernetes was self-managed, which taught me many things, primarily that I do not have the temperament to manage Kubernetes. I spent weeks tuning etcd, debugging network overlays, and developing what I can only describe as a personal relationship with a persistent volume that refused to mount. It was less a technical exercise and more a form of digitally enhanced psychotherapy.
GKE’s Autopilot mode sidesteps all this by simply making the nodes disappear. You do not manage nodes. You do not upgrade nodes. You do not even, strictly speaking, know where the nodes are. They exist in the same conceptual space as socks that vanish from laundry cycles. You request resources, and they materialise, like summoning a very specific and obliging genie. The first time I enabled Autopilot, I felt I was cheating somehow, as if I had been given the answers to an exam I had not revised for.
The real genius is Workload Identity, a feature that allows pods to access Google services without storing secrets. Before this, secret management was a dark art involving base64 encoding and whispered incantations. We kept our API keys in Kubernetes secrets, which is rather like keeping your house keys under the doormat and hoping burglars are too polite to look there. Workload Identity removes all this by using magic, or possibly certificates, which are essentially the same thing in cloud computing. I demonstrated it to our security team, and their reaction was instructive. They smiled, which security people never do, and then they asked me to prove it was actually secure, which took another three days and several diagrams involving stick figures.
Istio integration completes the picture, though calling it integration suggests a gentle handshake when it is more like being embraced by a very enthusiastic octopus. It gives you observability, security, and traffic management at the cost of considerable complexity and a mild feeling that you have lost control of your own architecture. Our first Istio deployment doubled our pod count and introduced latency that made our application feel like it was wading through treacle. Tuning it took weeks and required someone with a master’s degree in distributed systems and the patience of a saint. When it finally worked, it was magnificent. Requests flowed like water, security policies enforced themselves with silent efficiency, and I felt like a man who had tamed a tiger through sheer persistence and a lot of treats.
Cloud Deploy and the gentle art of not breaking everything
Progressive delivery sounds like something a management consultant would propose during a particularly expensive lunch, but Cloud Deploy makes it almost sensible. The service orchestrates rollouts across environments with strategies like canary and blue-green, which are named after birds and colours because naming things is hard, and DevOps engineers have a certain whimsical desperation about them.
My first successful canary deployment felt like performing surgery on a patient who was also the anaesthetist. We routed 5 percent of traffic to the new version and watched our metrics like nervous parents at a school play. When errors spiked, I expected a frantic rollback procedure involving SSH and tarballs. Instead, I clicked a button, and everything reverted in thirty seconds. The old version simply reappeared, fully formed, like a magic trick performed by someone who actually understands magic. I walked around the office for the rest of the day with what my colleagues described as a smug grin, though I prefer to think of it as the justified expression of someone who has witnessed a minor miracle.
The integration with Cloud Build creates a pipeline so smooth it is almost suspicious. Code commits trigger builds, builds trigger deployments, deployments trigger monitoring alerts, and alerts trigger automated rollbacks. It is a closed loop, a perpetual motion machine of software delivery. I once watched this entire chain execute while I was making a sandwich. By the time I had finished my ham and pickle on rye, a critical bug had been introduced, detected, and removed from production without any human intervention. I was simultaneously impressed and vaguely concerned about my own obsolescence.
Artifact Registry where containers go to mature
Storing artifacts used to involve a self-hosted Nexus repository that required weekly sacrifices of disk space and RAM. Artifact Registry is Google’s answer to this, a fully managed service that stores Docker images, Helm charts, and language packages with the solemnity of a wine cellar for code.
The vulnerability scanning here is particularly thorough, examining every layer of your container with the obsessive attention of someone who alphabetises their spice rack. It once flagged a high-severity issue in a base image we had been using for six months. The vulnerability allowed arbitrary code execution, which is the digital equivalent of leaving your front door open with a sign saying “Free laptops inside.” We had to rebuild and redeploy forty services in two days. The scanner, naturally, had known about this all along but had been politely waiting for us to notice.
Geo-replication is another feature that seems obvious until you need it. Our New Zealand team was pulling images from a European registry, which meant every deployment involved sending gigabytes of data halfway around the world. This worked about as well as shouting instructions across a rugby field during a storm. Moving to a regional registry in New Zealand cut our deployment times by half and our egress fees by a third. It also taught me that cloud networking operates on principles that are part physics, part economics, and part black magic.
Cloud Operations Suite or how I learned to love the machine that watches me
Observability in GCP is orchestrated by the Cloud Operations Suite, formerly known as Stackdriver. The rebranding was presumably because Stackdriver sounded too much like a dating app for developers, which is a missed opportunity if you ask me.
The suite unifies logs, metrics, traces, and dashboards into a single interface that is both comprehensive and bewildering. The first time I opened Cloud Monitoring, I was presented with more graphs than a hedge fund’s annual report. CPU, memory, network throughput, disk IOPS, custom metrics, uptime checks, and SLO burn rates. It was beautiful and terrifying, like watching the inner workings of a living organism that you have created but do not fully understand.
Setting up SLOs felt like writing a promise to my future self. “I, a DevOps engineer of sound mind, do hereby commit to maintaining 99.9 percent availability.” The system then watches your service like a particularly judgmental deity and alerts you the moment you transgress. I once received a burn rate alert at 2 AM because a pod had been slightly slow for ten minutes. I lay in bed, staring at my phone, wondering whether to fix it or simply accept that perfection was unattainable and go back to sleep. I fixed it, of course. We always do.
The integration with BigQuery for long-term analysis is where things get properly clever. We export all our logs and run SQL queries to find patterns. This is essentially data archaeology, sifting through digital sediment to understand why something broke three weeks ago. I discovered that our highest error rates always occurred on Tuesdays between 2 and 3 PM. Why? A scheduled job that had been deprecated but never removed, running on a server everyone had forgotten about. Finding it felt like discovering a Roman coin in your garden, exciting but also slightly embarrassing that you hadn’t noticed it before.
Cloud Monitoring and Logging the digital equivalent of a nervous system
Cloud Logging centralises petabytes of data from services that generate logs with the enthusiasm of a teenager documenting their lunch. Querying this data feels like using a search engine that actually works, which is disconcerting when you’re used to grep and prayer.
I once spent an afternoon tracking down a memory leak using Cloud Profiler, a service that shows you exactly where your code is being wasteful with RAM. It highlighted a function that was allocating memory like a government department allocates paper clips, with cheerful abandon and no regard for consequences. The function turned out to be logging entire database responses for debugging purposes, in production, for six months. We had archived more debug data than actual business data. The developer responsible, when confronted, simply shrugged and said it had seemed like a good idea at the time. This is the eternal DevOps tragedy. Everything seems like a good idea at the time.
Uptime checks are another small miracle. We have probes hitting our endpoints from locations around the world, like a global network of extremely polite bouncers constantly asking, “Are you open?” When Mumbai couldn’t reach our service but London could, it led us to discover a regional DNS issue that would have taken days to diagnose otherwise. The probes had saved us, and they had done so without complaining once, which is more than can be said for the on-call engineer who had to explain it to management at 6 AM.
Cloud Functions and Cloud Run, where code goes to hide
Serverless computing in GCP comes in two flavours. Cloud Functions are for small, event-driven scripts, like having a very eager intern who only works when you clap. Cloud Run is for containerised applications that scale to zero, which is an economical way of saying they disappear when nobody needs them and materialise when they do, like an introverted ghost.
I use Cloud Functions for automation tasks that would otherwise require cron jobs on a VM that someone has to maintain. One function resizes GKE clusters based on Cloud Monitoring alerts. When CPU utilisation exceeds 80 percent for five minutes, the function spins up additional nodes. When it drops below 20 percent, it scales down. This is brilliant until you realise you’ve created a feedback loop and the cluster is now oscillating between one node and one hundred nodes every ten minutes. Tuning the thresholds took longer than writing the function, which is the serverless way.
Cloud Run hosts our internal tools, the dashboards, and debug interfaces that developers need but nobody wants to provision infrastructure for. Deploying is gloriously simple. You push a container, it runs. The cold start time is sub-second, which means Google has solved a problem that Lambda users have been complaining about for years, presumably by bargaining with physics itself. I once deployed a debugging tool during an incident response. It was live before the engineer who requested it had finished describing what they needed. Their expression was that of someone who had asked for a coffee and been given a flying saucer.
Terraform and Cloud Deployment Manager arguing with machines about infrastructure
Infrastructure as Code is the principle that you should be able to rebuild your entire environment from a text file, which is lovely in theory and slightly terrifying in practice. Terraform, using the GCP provider, is the de facto standard. It is also a source of endless frustration and occasional joy.
The state file is the heart of the problem. It is a JSON representation of your infrastructure that Terraform keeps in Cloud Storage, and it is the single source of truth until someone deletes it by accident, at which point the truth becomes rather more philosophical. We lock the state during applies, which prevents conflicts but also means that if an apply hangs, everyone is blocked. I have spent afternoons staring at a terminal, watching Terraform ponder the nature of a load balancer, like a stoned philosophy student contemplating a spoon.
Deployment Manager is Google’s native IaC tool, which uses YAML and is therefore slightly less powerful but considerably easier to read. I use it for simple projects where Terraform would be like using a sledgehammer to crack a nut, if the sledgehammer required you to understand graph theory. The two tools coexist uneasily, like cats who tolerate each other for the sake of the humans.
Drift detection is where things get properly philosophical. Terraform tells you when reality has diverged from your code, which happens more often than you’d think. Someone clicks something in the console, a service account is modified, a firewall rule is added for “just a quick test.” The plan output shows these changes like a disappointed teacher marking homework in red pen. You can either apply the correction or accept that your infrastructure has developed a life of its own and is now making decisions independently. Sometimes I let the drift stand, just to see what happens. This is how accidents become features.
IAM and Cloud Asset Inventory, the endless game of who can do what
Identity and Access Management in GCP is both comprehensive and maddening. Every API call is authenticated and authorised, which is excellent for security but means you spend half your life granting permissions to service accounts. A service account, for the uninitiated, is a machine pretending to be a person so it can ask Google for things. They are like employees who never take a holiday but also never buy you a birthday card.
Workload Identity Federation allows these synthetic employees to impersonate each other across clouds, which is identity management crossed with method acting. We use it to let our AWS workloads access GCP resources, a process that feels rather like introducing two friends who are suspicious of each other and speak different languages. When it works, it is seamless. When it fails, the error messages are so cryptic they may as well be in Linear B.
Cloud Asset Inventory catalogs every resource in your organisation, which is invaluable for audits and deeply unsettling when you realise just how many things you’ve created and forgotten about. I once ran a report and discovered seventeen unused load balancers, three buckets full of logs from a project that ended in 2023, and a Cloud SQL instance that had been running for six months with no connections. The bill was modest, but the sense of waste was profound. I felt like a hoarder being confronted with their own clutter.
For European enterprises, the GDPR compliance features are critical. We export audit logs to BigQuery and run queries to prove data residency. The auditors, when they arrived, were suspicious of everything, which is their job. They asked for proof that data never left the europe-west3 region. I showed them VPC Service Controls, which are like digital border guards that shoot packets trying to cross geographical boundaries. They seemed satisfied, though one of them asked me to explain Kubernetes, and I saw his eyes glaze over in the first thirty seconds. Some concepts are simply too abstract for mortal minds.
Eventarc and Cloud Scheduler the nervous system of the cloud
Eventarc routes events from over 100 sources to your serverless functions, creating event-driven architectures that are both elegant and impossible to debug. An event is a notification that something happened, somewhere, and now something else should happen somewhere else. It is causality at a distance, action at a remove.
I have an Eventarc trigger that fires when a vulnerability is found, sending a message to Pub/Sub, which fans out to multiple subscribers. One subscriber posts to Slack, another creates a ticket, and a third quarantines the image. It is a beautiful, asynchronous ballet that I cannot fully trace. When it fails, it fails silently, like a mime having a heart attack. The dead-letter queue catches the casualties, which I check weekly like a coroner reviewing unexplained deaths.
Cloud Scheduler handles cron jobs, which are the digital equivalent of remembering to take the bins out. We have schedules that scale down non-production environments at night, saving money and carbon. I once set the timezone incorrectly and scaled down the production cluster at midday. The outage lasted three minutes, but the shame lasted considerably longer. The team now calls me “the scheduler whisperer,” which is not the compliment it sounds like.
The real power comes from chaining these services. A Monitoring alert triggers Eventarc, which invokes a Cloud Function, which checks something via Scheduler, which then triggers another function to remediate. It is a Rube Goldberg machine built of code, more complex than it needs to be, but weirdly satisfying when it works. I have built systems that heal themselves, which is either the pinnacle of DevOps achievement or the first step towards Skynet. I prefer to think it is the former.
The map we all pretend to understand
Every DevOps journey, no matter how anecdotal, eventually requires what consultants call a “high-level architecture overview” and what I call a desperate attempt to comprehend the incomprehensible. During my second year on GCP, I created exactly such a diagram to explain to our CFO why we were spending $47,000 a month on something called “Cross-Regional Egress.” The CFO remained unmoved, but the diagram became my Rosetta Stone for navigating the platform’s ten core services.
I’ve reproduced it here partly because I spent three entire afternoons aligning boxes in Lucidchart, and partly because even the most narrative-driven among us occasionally needs to see the forest’s edge while wandering through the trees. Consider it the technical appendix you can safely ignore, unless you’re the poor soul actually implementing any of this.
There it is, in all its tabular glory. Five rows that represent roughly fifteen thousand hours of human effort, and at least three separate incidents involving accidentally deleted production namespaces. The arrows are neat and tidy, which is more than can be said for any actual implementation.
I keep a laminated copy taped to my monitor, not because I consult it; I have the contents memorised, along with the scars that accompany each service, but because it serves as a reminder that even the most chaotic systems can be reduced to something that looks orderly on PowerPoint. The real magic lives in the gaps between those tidy boxes, where service accounts mysteriously expire, where network policies behave like quantum particles, and where the monthly bill arrives with numbers that seem generated by a random number generator with a grudge.
A modest proposal for surviving GCP
That table represents the map. What follows is the territory, with all its muddy bootprints and unexpected cliffs.
After three years, I have learned that the best DevOps engineers are not the ones with the most certificates. They are the ones who have learned to read the runes, who know which logs matter and which can be ignored, who have developed an intuitive sense for when a deployment is about to fail and can smell a misconfigured IAM binding at fifty paces. They are part sysadmin, part detective, part wizard.
The platform makes many things possible, but it does not make them easy. It is infrastructure for grown-ups, which is to say it trusts you to make expensive mistakes and learn from them. My advice is to start small, automate everything, and keep a sense of humour. You will need it the first time you accidentally delete a production bucket and discover that the undo button is marked “open a support ticket and wait.”
Store your manifests in Git and let Cloud Deploy handle the applying. Define SLOs and let the machines judge you. Tag resources for cost allocation and prepare to be horrified by the results. Replicate artifacts across regions because the internet is not as reliable as we pretend. And above all, remember that the cloud is not magic. It is simply other people’s computers running other people’s code, orchestrated by APIs that are occasionally documented and frequently misunderstood.
We build on these foundations because they let us move faster, scale further, and sleep slightly better at night, knowing that somewhere in a data centre in Belgium, a robot is watching our servers and will wake us only if things get truly interesting.
That is the theory, anyway. In practice, I still keep my phone on loud, just in case.