Your monthly cloud infrastructure bill arrives in your inbox. You open the PDF document, and suddenly your left eyelid starts twitching uncontrollably. The finance department has started leaving passive-aggressive sticky notes on your monitor. You realize you are spending the equivalent of a small nation’s gross domestic product just to store text files that repeat “INFO: User logged in” three billion times a day. Welcome to the modern logging crisis.
For years, the Kubernetes logging ecosystem was basically on autopilot. You installed the EFK stack (Elasticsearch, Fluentd, and Kibana), and it just worked. It was the safest default in the industry. But as we navigate through 2026, something has fundamentally ruptured. EFK did not suddenly become toxic waste overnight. It simply became the victim of its own architecture in an era where log volumes have mutated into unrecognizable monsters.
The shift away from EFK is not driven by shiny object syndrome. It is driven by raw economics, hardware exhaustion, and the very human desire not to wake up sweating at 3 AM because a logging cluster ran out of disk space.
The golden retriever in the sausage factory
Let us start with Fluentd. Fluentd is incredibly stable, highly flexible, and has served the community well. However, it is written in Ruby.
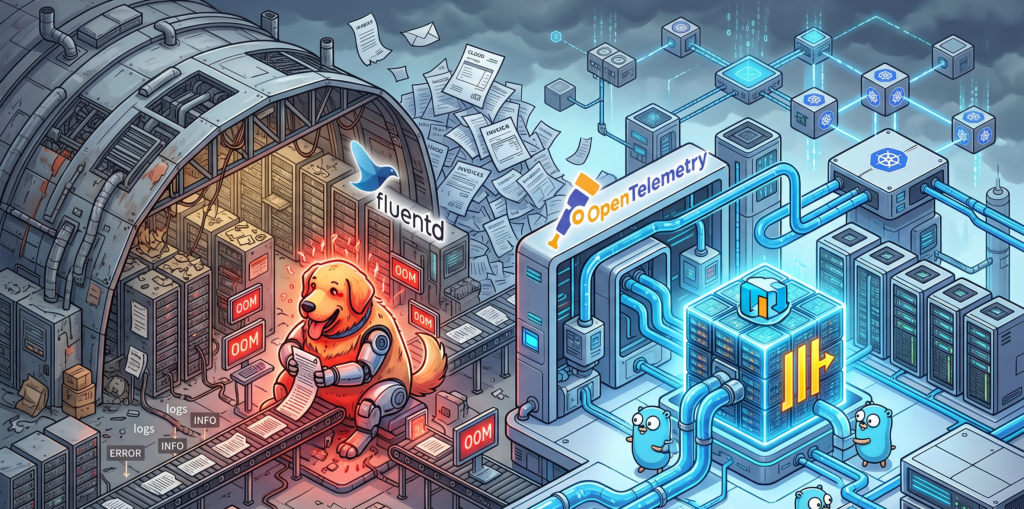
Under moderate loads, Fluentd is a perfectly polite guest. But when you expose it to the high-demand environments of modern microservices, Fluentd exhibits the same impulse control as an unsupervised Golden Retriever locked inside a sausage factory. It just eats all your available CPU and RAM until it physically cannot hold any more, burps an Out Of Memory error, and then politely demands that you scale it horizontally.
This operational overhead becomes exhausting. The industry needed something leaner. Enter the OpenTelemetry Collector. Written in Go, it processes telemetry data with the cold, calculated efficiency of an IRS auditor. It handles metrics, traces, and logs in a unified pipeline without treating your server’s memory like an all you can eat buffet.
Here is what a modern, lightweight pipeline configuration looks like today, completely devoid of Ruby overhead:
# OpenTelemetry Collector routing logs without eating your RAM
receivers:
  filelog:
    include: [ /var/log/pods/*/*/*.log ]
exporters:
  clickhouse:
    endpoint: tcp://clickhouse-server:9000
    database: observability
service:
  pipelines:
    logs:
      receivers: [filelog]
      exporters: [clickhouse]
Packing your socks in industrial hangars
The real villain in your cloud bill, however, is not the collector. It is the storage layer. Elasticsearch is an absolute marvel of engineering if you are trying to build a complex search engine for an e-commerce website. But using it exclusively to store application logs is an architectural tragedy.
Storing logs in Elasticsearch is like packing a single pair of socks in an individual cardboard box, wrapping that box in three layers of industrial bubble wrap, and attaching a GPS tracker to it. Yes, the inverted index structure guarantees that you will find those specific socks at the speed of light. But your luggage now occupies three entire aviation hangars, and the monthly rent is absurd. The indexing process creates massive data bloat, multiplying your storage footprint and your anxiety levels simultaneously.
The bouillon cube of observability
This is where ClickHouse enters the scene and aggressively rewrites the rules. ClickHouse looks at your three hangars full of bubble-wrapped socks, throws them into an industrial shredder, and compresses the resulting mass into a super dense data bouillon cube.
ClickHouse relies on columnar storage and sparse indexes. It does not index every single word of your log lines. Instead, it compresses the data so tightly that your storage footprint shrinks to a fraction of what EFK required. And because developers already dream in SQL, querying this massive block of data feels entirely natural.
Instead of wrestling with Kibana’s proprietary query language just to find out why a payment failed, your team can simply run a query like this:
-- Finding errors without going bankrupt
SELECT
    toStartOfMinute(timestamp) AS minute,
    count() AS total_errors,
    dictGet('services', 'name', service_id) AS service_name
FROM application_logs
WHERE level = 'ERROR' AND timestamp > now() - INTERVAL 1 HOUR
GROUP BY minute, service_name
ORDER BY minute DESC;
Grafana sits on top of this SQL engine like a happy gargoyle, providing the exact same dashboarding capabilities you used to get from Kibana, but with the added benefit of seamlessly linking your logs directly to your OpenTelemetry metrics and traces.
Swapping tires on the highway
Now, a word of caution. The worst thing you can do after reading this is to march into your office and delete your Elasticsearch cluster.
Transitioning from EFK to the OpenTelemetry and ClickHouse stack overnight is the IT equivalent of trying to change your car tires while driving at 120 miles per hour down the highway. You will almost certainly lose the chassis in the process.
A migration requires a gradual cutover. You must deploy the OpenTelemetry Collector alongside your existing Fluentd setup. Route a small subset of non critical logs to ClickHouse. Compare the ingestion rates. Let your team practice writing SQL queries to find errors. Only when you are confident that the bouillon cube is holding its shape should you start decommissioning the old, expensive hangars.
When to completely ignore my advice
To be perfectly fair, EFK is not dead for everyone. If your daily log volume fits comfortably on a standard thumb drive, or if your company enjoys setting fire to piles of corporate cash to keep the server room warm, EFK remains a wonderfully easy solution. If your team has zero experience managing relational databases and relies heavily on managed Elasticsearch services, moving to ClickHouse might introduce more friction than it resolves.
But for the rest of the world, the verdict is clear. Do not migrate just because it is trendy. Migrate because your current system has become a financial bottleneck. If your Elasticsearch bill is the fastest growing metric in your entire company, that is your signal. Run the numbers, evaluate the OpenTelemetry stack, and stop paying hangar prices for your socks.